v.0.7.3 (April 12, 2012)
This is a minor release from 0.7.2 and fixes many minor bugs and adds a number of nice new features. There are also a couple of API changes to note; these should not affect very many users, and we are inclined to call them “bug fixes” even though they do constitute a change in behavior. See the full release notes or issue tracker on GitHub for a complete list.
New features
- New fixed width file reader,
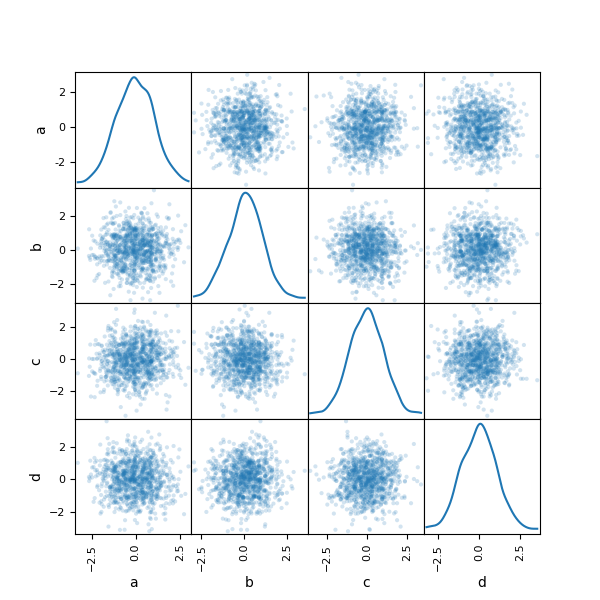
read_fwf - New scatter_matrix function for making a scatter plot matrix
from pandas.tools.plotting import scatter_matrix
scatter_matrix(df, alpha=0.2)        # noqa F821
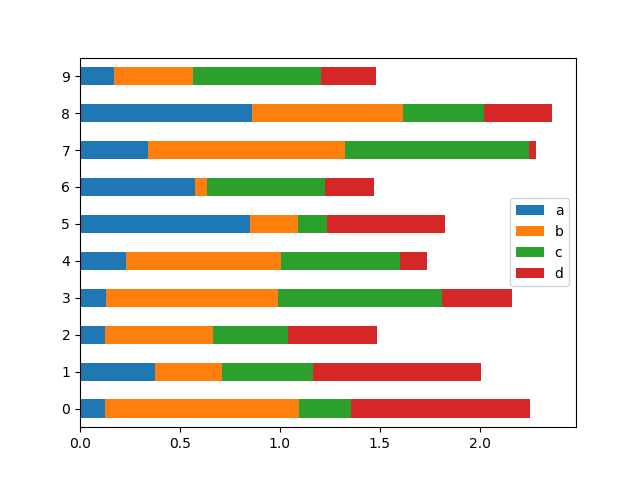
- Add
stackedargument to Series and DataFrame’splotmethod for stacked bar plots.
df.plot(kind='bar', stacked=True) # noqa F821
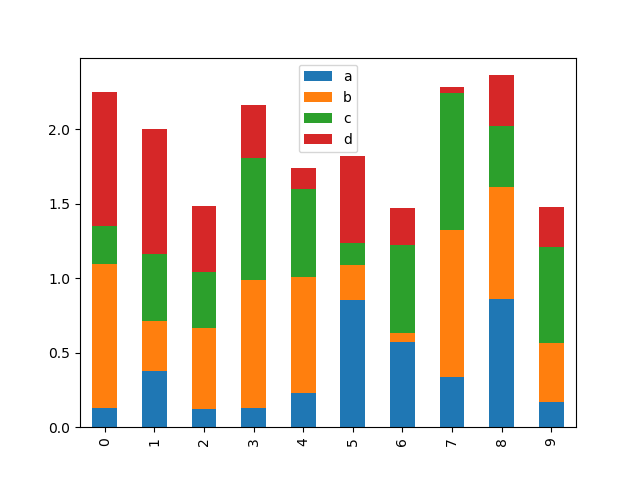
df.plot(kind='barh', stacked=True) # noqa F821
- Add log x and y scaling options to
DataFrame.plotandSeries.plot - Add
kurtmethods to Series and DataFrame for computing kurtosis
NA Boolean Comparison API Change
Reverted some changes to how NA values (represented typically as NaN or
None) are handled in non-numeric Series:
In [1]: series = pd.Series(['Steve', np.nan, 'Joe'])
In [2]: series == 'Steve'
Out[2]:
0 True
1 False
2 False
Length: 3, dtype: bool
In [3]: series != 'Steve'
�����������������������������������������������������������������Out[3]:
0 False
1 True
2 True
Length: 3, dtype: bool
In comparisons, NA / NaN will always come through as False except with
!= which is True. Be very careful with boolean arithmetic, especially
negation, in the presence of NA data. You may wish to add an explicit NA
filter into boolean array operations if you are worried about this:
In [4]: mask = series == 'Steve'

In [5]: series[mask & series.notnull()]
Out[5]:
0    Steve
Length: 1, dtype: object
While propagating NA in comparisons may seem like the right behavior to some users (and you could argue on purely technical grounds that this is the right thing to do), the evaluation was made that propagating NA everywhere, including in numerical arrays, would cause a large amount of problems for users. Thus, a “practicality beats purity” approach was taken. This issue may be revisited at some point in the future.
Other API Changes
When calling apply on a grouped Series, the return value will also be a
Series, to be more consistent with the groupby behavior with DataFrame:
In [6]: df = pd.DataFrame({'A': ['foo', 'bar', 'foo', 'bar',
...: 'foo', 'bar', 'foo', 'foo'],
...: 'B': ['one', 'one', 'two', 'three',
...: 'two', 'two', 'one', 'three'],
...: 'C': np.random.randn(8), 'D': np.random.randn(8)})
...:
In [7]: df
Out[7]:
A B C D
0 foo one 0.469112 -0.861849
1 bar one -0.282863 -2.104569
2 foo two -1.509059 -0.494929
3 bar three -1.135632 1.071804
4 foo two 1.212112 0.721555
5 bar two -0.173215 -0.706771
6 foo one 0.119209 -1.039575
7 foo three -1.044236 0.271860
[8 rows x 4 columns]
In [8]: grouped = df.groupby('A')['C']
In [9]: grouped.describe()
Out[9]:
count mean std min 25% 50% 75% max
A
bar 3.0 -0.530570 0.526860 -1.135632 -0.709248 -0.282863 -0.228039 -0.173215
foo 5.0 -0.150572 1.113308 -1.509059 -1.044236 0.119209 0.469112 1.212112
[2 rows x 8 columns]
In [10]: grouped.apply(lambda x: x.sort_values()[-2:]) # top 2 values
�������������������������������������������������������������������������������������������������������������������������������������������������������������������������������������������������������������������������������������������������������������������������������������������������������������������������������������������������������������������Out[10]:
A
bar 1 -0.282863
5 -0.173215
foo 0 0.469112
4 1.212112
Name: C, Length: 4, dtype: float64
Contributors
A total of 15 people contributed patches to this release. People with a “+” by their names contributed a patch for the first time.
- Abraham Flaxman +
- Adam Klein
- Andreas H. +
- Chang She
- Dieter Vandenbussche
- Jacques Kvam +
- K.-Michael Aye +
- Kamil Kisiel +
- Martin Blais +
- Skipper Seabold
- Thomas Kluyver
- Wes McKinney
- Wouter Overmeire
- Yaroslav Halchenko
- lgautier +