Working with missing data
In this section, we will discuss missing (also referred to as NA) values in pandas.
Note
The choice of using NaN internally to denote missing data was largely for simplicity and performance reasons. It differs from the MaskedArray approach of, for example, scikits.timeseries. We are hopeful that NumPy will soon be able to provide a native NA type solution (similar to R) performant enough to be used in pandas.
See the cookbook for some advanced strategies
Missing data basics
When / why does data become missing?
Some might quibble over our usage of missing. By “missing” we simply mean null or “not present for whatever reason”. Many data sets simply arrive with missing data, either because it exists and was not collected or it never existed. For example, in a collection of financial time series, some of the time series might start on different dates. Thus, values prior to the start date would generally be marked as missing.
In pandas, one of the most common ways that missing data is introduced into a data set is by reindexing. For example
In [1]: df = DataFrame(randn(5, 3), index=['a', 'c', 'e', 'f', 'h'],
   ...:                columns=['one', 'two', 'three'])
   ...:

In [2]: df['four'] = 'bar'

In [3]: df['five'] = df['one'] > 0

In [4]: df

        one       two     three four   five
a -0.438460  1.619664 -0.156589  bar  False
c -0.426514 -1.028828  0.409237  bar  False
e  1.422925  1.199683 -0.106996  bar   True
f -0.908243  1.422547 -0.647947  bar  False
h  0.087149 -1.679253 -1.636722  bar   True

In [5]: df2 = df.reindex(['a', 'b', 'c', 'd', 'e', 'f', 'g', 'h'])

In [6]: df2

        one       two     three four   five
a -0.438460  1.619664 -0.156589  bar  False
b       NaN       NaN       NaN  NaN    NaN
c -0.426514 -1.028828  0.409237  bar  False
d       NaN       NaN       NaN  NaN    NaN
e  1.422925  1.199683 -0.106996  bar   True
f -0.908243  1.422547 -0.647947  bar  False
g       NaN       NaN       NaN  NaN    NaN
h  0.087149 -1.679253 -1.636722  bar   True
Values considered “missing”
As data comes in many shapes and forms, pandas aims to be flexible with regard to handling missing data. While NaN is the default missing value marker for reasons of computational speed and convenience, we need to be able to easily detect this value with data of different types: floating point, integer, boolean, and general object. In many cases, however, the Python None will arise and we wish to also consider that “missing” or “null”.
Until recently, for legacy reasons inf and -inf were also considered to be “null” in computations. This is no longer the case by default; use the mode.use_inf_as_null option to recover it.
To make detecting missing values easier (and across different array dtypes), pandas provides the isnull() and notnull() functions, which are also methods on Series objects:
In [7]: df2['one']

a   -0.438460
b         NaN
c   -0.426514
d         NaN
e    1.422925
f   -0.908243
g         NaN
h    0.087149
Name: one, dtype: float64

In [8]: isnull(df2['one'])

a    False
b     True
c    False
d     True
e    False
f    False
g     True
h    False
Name: one, dtype: bool

In [9]: df2['four'].notnull()

a     True
b    False
c     True
d    False
e     True
f     True
g    False
h     True
dtype: bool
Summary: NaN and None (in object arrays) are considered missing by the isnull and notnull functions. inf and -inf are no longer considered missing by default.
Datetimes
For datetime64[ns] types, NaT represents missing values. This is a pseudo-native sentinal value that can be represented by numpy in a singular dtype (datetime64[ns]). Pandas objects provide intercompatibility between NaT and NaN.
In [10]: df2 = df.copy()

In [11]: df2['timestamp'] = Timestamp('20120101')

In [12]: df2

        one       two     three four   five           timestamp
a -0.438460  1.619664 -0.156589  bar  False 2012-01-01 00:00:00
c -0.426514 -1.028828  0.409237  bar  False 2012-01-01 00:00:00
e  1.422925  1.199683 -0.106996  bar   True 2012-01-01 00:00:00
f -0.908243  1.422547 -0.647947  bar  False 2012-01-01 00:00:00
h  0.087149 -1.679253 -1.636722  bar   True 2012-01-01 00:00:00

In [13]: df2.ix[['a','c','h'],['one','timestamp']] = np.nan

In [14]: df2

        one       two     three four   five           timestamp
a       NaN  1.619664 -0.156589  bar  False                 NaT
c       NaN -1.028828  0.409237  bar  False                 NaT
e  1.422925  1.199683 -0.106996  bar   True 2012-01-01 00:00:00
f -0.908243  1.422547 -0.647947  bar  False 2012-01-01 00:00:00
h       NaN -1.679253 -1.636722  bar   True                 NaT

In [15]: df2.get_dtype_counts()

bool              1
datetime64[ns]    1
float64           3
object            1
dtype: int64
Calculations with missing data
Missing values propagate naturally through arithmetic operations between pandas objects.
In [16]: a

        one       two
a       NaN  1.619664
c       NaN -1.028828
e  1.422925  1.199683
f -0.908243  1.422547
h -0.908243 -1.679253

In [17]: b

        one       two     three
a       NaN  1.619664 -0.156589
c       NaN -1.028828  0.409237
e  1.422925  1.199683 -0.106996
f -0.908243  1.422547 -0.647947
h       NaN -1.679253 -1.636722

In [18]: a + b

        one  three       two
a       NaN    NaN  3.239329
c       NaN    NaN -2.057655
e  2.845850    NaN  2.399366
f -1.816486    NaN  2.845093
h       NaN    NaN -3.358505
The descriptive statistics and computational methods discussed in the data structure overview (and listed here and here) are all written to account for missing data. For example:
- When summing data, NA (missing) values will be treated as zero
- If the data are all NA, the result will be NA
- Methods like cumsum and cumprod ignore NA values, but preserve them in the resulting arrays
In [19]: df

        one       two     three
a       NaN  1.619664 -0.156589
c       NaN -1.028828  0.409237
e  1.422925  1.199683 -0.106996
f -0.908243  1.422547 -0.647947
h       NaN -1.679253 -1.636722

In [20]: df['one'].sum()
0.51468201281996417

In [21]: df.mean(1)

a    0.731538
c   -0.309795
e    0.838537
f   -0.044548
h   -1.657987
dtype: float64

In [22]: df.cumsum()

        one       two     three
a       NaN  1.619664 -0.156589
c       NaN  0.590837  0.252648
e  1.422925  1.790520  0.145653
f  0.514682  3.213067 -0.502294
h       NaN  1.533814 -2.139016
NA values in GroupBy
NA groups in GroupBy are automatically excluded. This behavior is consistent with R, for example.
Cleaning / filling missing data
pandas objects are equipped with various data manipulation methods for dealing with missing data.
Filling missing values: fillna
The fillna function can “fill in” NA values with non-null data in a couple of ways, which we illustrate:
Replace NA with a scalar value
In [23]: df2

        one       two     three four   five           timestamp
a       NaN  1.619664 -0.156589  bar  False                 NaT
c       NaN -1.028828  0.409237  bar  False                 NaT
e  1.422925  1.199683 -0.106996  bar   True 2012-01-01 00:00:00
f -0.908243  1.422547 -0.647947  bar  False 2012-01-01 00:00:00
h       NaN -1.679253 -1.636722  bar   True                 NaT

In [24]: df2.fillna(0)

        one       two     three four   five           timestamp
a  0.000000  1.619664 -0.156589  bar  False 1970-01-01 00:00:00
c  0.000000 -1.028828  0.409237  bar  False 1970-01-01 00:00:00
e  1.422925  1.199683 -0.106996  bar   True 2012-01-01 00:00:00
f -0.908243  1.422547 -0.647947  bar  False 2012-01-01 00:00:00
h  0.000000 -1.679253 -1.636722  bar   True 1970-01-01 00:00:00

In [25]: df2['four'].fillna('missing')

a    bar
c    bar
e    bar
f    bar
h    bar
Name: four, dtype: object
Fill gaps forward or backward
Using the same filling arguments as reindexing, we can propagate non-null values forward or backward:
In [26]: df

        one       two     three
a       NaN  1.619664 -0.156589
c       NaN -1.028828  0.409237
e  1.422925  1.199683 -0.106996
f -0.908243  1.422547 -0.647947
h       NaN -1.679253 -1.636722

In [27]: df.fillna(method='pad')

        one       two     three
a       NaN  1.619664 -0.156589
c       NaN -1.028828  0.409237
e  1.422925  1.199683 -0.106996
f -0.908243  1.422547 -0.647947
h -0.908243 -1.679253 -1.636722
Limit the amount of filling
If we only want consecutive gaps filled up to a certain number of data points, we can use the limit keyword:
In [28]: df

   one       two     three
a  NaN  1.619664 -0.156589
c  NaN -1.028828  0.409237
e  NaN       NaN       NaN
f  NaN       NaN       NaN
h  NaN -1.679253 -1.636722

In [29]: df.fillna(method='pad', limit=1)

   one       two     three
a  NaN  1.619664 -0.156589
c  NaN -1.028828  0.409237
e  NaN -1.028828  0.409237
f  NaN       NaN       NaN
h  NaN -1.679253 -1.636722
To remind you, these are the available filling methods:
| Method | Action |
|---|---|
| pad / ffill | Fill values forward |
| bfill / backfill | Fill values backward |
With time series data, using pad/ffill is extremely common so that the “last known value” is available at every time point.
Dropping axis labels with missing data: dropna
You may wish to simply exclude labels from a data set which refer to missing data. To do this, use the dropna method:
In [30]: df

   one       two     three
a  NaN  1.619664 -0.156589
c  NaN -1.028828  0.409237
e  NaN  0.000000  0.000000
f  NaN  0.000000  0.000000
h  NaN -1.679253 -1.636722

In [31]: df.dropna(axis=0)

Empty DataFrame
Columns: [one, two, three]
Index: []

In [32]: df.dropna(axis=1)

        two     three
a  1.619664 -0.156589
c -1.028828  0.409237
e  0.000000  0.000000
f  0.000000  0.000000
h -1.679253 -1.636722

In [33]: df['one'].dropna()
Series([], dtype: float64)
dropna is presently only implemented for Series and DataFrame, but will be eventually added to Panel. Series.dropna is a simpler method as it only has one axis to consider. DataFrame.dropna has considerably more options, which can be examined in the API.
Interpolation
A linear interpolate method has been implemented on Series. The default interpolation assumes equally spaced points.
In [34]: ts.count()
61
In [35]: ts.head()
2000-01-31 0.469112
2000-02-29 NaN
2000-03-31 NaN
2000-04-28 NaN
2000-05-31 NaN
Freq: BM, dtype: float64
In [36]: ts.interpolate().count()
100
In [37]: ts.interpolate().head()
2000-01-31 0.469112
2000-02-29 0.435428
2000-03-31 0.401743
2000-04-28 0.368059
2000-05-31 0.334374
Freq: BM, dtype: float64
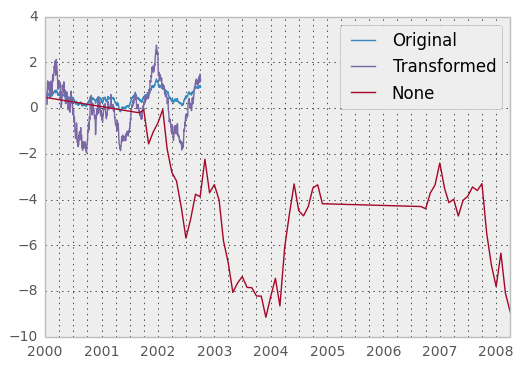
In [38]: ts.interpolate().plot()
<matplotlib.axes.AxesSubplot at 0x6eb9810>
Index aware interpolation is available via the method keyword:
In [39]: ts

2000-01-31    0.469112
2000-02-29         NaN
2002-07-31   -5.689738
2005-01-31         NaN
2008-04-30   -8.916232
dtype: float64

In [40]: ts.interpolate()

2000-01-31    0.469112
2000-02-29   -2.610313
2002-07-31   -5.689738
2005-01-31   -7.302985
2008-04-30   -8.916232
dtype: float64

In [41]: ts.interpolate(method='time')

2000-01-31    0.469112
2000-02-29    0.273272
2002-07-31   -5.689738
2005-01-31   -7.095568
2008-04-30   -8.916232
dtype: float64
For a floating-point index, use method='values':
In [42]: ser

0      0
1    NaN
10    10
dtype: float64

In [43]: ser.interpolate()

0      0
1      5
10    10
dtype: float64

In [44]: ser.interpolate(method='values')

0      0
1      1
10    10
dtype: float64
Replacing Generic Values
Often times we want to replace arbitrary values with other values. New in v0.8 is the replace method in Series/DataFrame that provides an efficient yet flexible way to perform such replacements.
For a Series, you can replace a single value or a list of values by another value:
In [45]: ser = Series([0., 1., 2., 3., 4.])

In [46]: ser.replace(0, 5)

0    5
1    1
2    2
3    3
4    4
dtype: float64
You can replace a list of values by a list of other values:
In [47]: ser.replace([0, 1, 2, 3, 4], [4, 3, 2, 1, 0])

0    4
1    3
2    2
3    1
4    0
dtype: float64
You can also specify a mapping dict:
In [48]: ser.replace({0: 10, 1: 100})

0     10
1    100
2      2
3      3
4      4
dtype: float64
For a DataFrame, you can specify individual values by column:
In [49]: df = DataFrame({'a': [0, 1, 2, 3, 4], 'b': [5, 6, 7, 8, 9]})

In [50]: df.replace({'a': 0, 'b': 5}, 100)

     a    b
0  100  100
1    1    6
2    2    7
3    3    8
4    4    9
Instead of replacing with specified values, you can treat all given values as missing and interpolate over them:
In [51]: ser.replace([1, 2, 3], method='pad')

0    0
1    0
2    0
3    0
4    4
dtype: float64
String/Regular Expression Replacement
Note
Python strings prefixed with the r character such as r'hello world' are so-called “raw” strings. They have different semantics regarding backslashes than strings without this prefix. Backslashes in raw strings will be interpreted as an escaped backslash, e.g., r'\' == '\\'. You should read about them if this is unclear.
Replace the ‘.’ with nan (str -> str)
In [52]: d = {'a': range(4), 'b': list('ab..'), 'c': ['a', 'b', nan, 'd']}

In [53]: df = DataFrame(d)

In [54]: df.replace('.', nan)

   a    b    c
0  0    a    a
1  1    b    b
2  2  NaN  NaN
3  3  NaN    d
Now do it with a regular expression that removes surrounding whitespace (regex -> regex)
In [55]: df.replace(r'\s*\.\s*', nan, regex=True)

   a    b    c
0  0    a    a
1  1    b    b
2  2  NaN  NaN
3  3  NaN    d
Replace a few different values (list -> list)
In [56]: df.replace(['a', '.'], ['b', nan])

   a    b    c
0  0    b    b
1  1    b    b
2  2  NaN  NaN
3  3  NaN    d
list of regex -> list of regex
In [57]: df.replace([r'\.', r'(a)'], ['dot', '\1stuff'], regex=True)

   a       b       c
0  0  stuff  stuff
1  1       b       b
2  2     dot     NaN
3  3     dot       d
Only search in column 'b' (dict -> dict)
In [58]: df.replace({'b': '.'}, {'b': nan})

   a    b    c
0  0    a    a
1  1    b    b
2  2  NaN  NaN
3  3  NaN    d
Same as the previous example, but use a regular expression for searching instead (dict of regex -> dict)
In [59]: df.replace({'b': r'\s*\.\s*'}, {'b': nan}, regex=True)

   a    b    c
0  0    a    a
1  1    b    b
2  2  NaN  NaN
3  3  NaN    d
You can pass nested dictionaries of regular expressions that use regex=True
In [60]: df.replace({'b': {'b': r''}}, regex=True)

   a  b    c
0  0  a    a
1  1       b
2  2  .  NaN
3  3  .    d
or you can pass the nested dictionary like so
In [61]: df.replace(regex={'b': {r'\s*\.\s*': nan}})

   a    b    c
0  0    a    a
1  1    b    b
2  2  NaN  NaN
3  3  NaN    d
You can also use the group of a regular expression match when replacing (dict of regex -> dict of regex), this works for lists as well
In [62]: df.replace({'b': r'\s*(\.)\s*'}, {'b': r'\1ty'}, regex=True)

   a    b    c
0  0    a    a
1  1    b    b
2  2  .ty  NaN
3  3  .ty    d
You can pass a list of regular expressions, of which those that match will be replaced with a scalar (list of regex -> regex)
In [63]: df.replace([r'\s*\.\s*', r'a|b'], nan, regex=True)

   a   b    c
0  0 NaN  NaN
1  1 NaN  NaN
2  2 NaN  NaN
3  3 NaN    d
All of the regular expression examples can also be passed with the to_replace argument as the regex argument. In this case the value argument must be passed explicity by name or regex must be a nested dictionary. The previous example, in this case, would then be
In [64]: df.replace(regex=[r'\s*\.\s*', r'a|b'], value=nan)

   a   b    c
0  0 NaN  NaN
1  1 NaN  NaN
2  2 NaN  NaN
3  3 NaN    d
This can be convenient if you do not want to pass regex=True every time you want to use a regular expression.
Note
Anywhere in the above replace examples that you see a regular expression a compiled regular expression is valid as well.
Numeric Replacement
Similiar to DataFrame.fillna
In [65]: df = DataFrame(randn(10, 2))

In [66]: df[rand(df.shape[0]) > 0.5] = 1.5

In [67]: df.replace(1.5, nan)

          0         1
0       NaN       NaN
1       NaN       NaN
2  2.396780  0.014871
3       NaN       NaN
4       NaN       NaN
5       NaN       NaN
6       NaN       NaN
7  0.084844  0.432390
8  1.519970 -0.493662
9       NaN       NaN
Replacing more than one value via lists works as well
In [68]: df00 = df.values[0, 0]

In [69]: df.replace([1.5, df00], [nan, 'a'])

            0           1
0           a           a
1           a           a
2     2.39678  0.01487095
3           a           a
4           a           a
5           a           a
6           a           a
7  0.08484421   0.4323898
8     1.51997  -0.4936621
9           a           a

In [70]: df[1].dtype
dtype('float64')
You can also operate on the DataFrame in place
In [71]: df.replace(1.5, nan, inplace=True)
Missing data casting rules and indexing
While pandas supports storing arrays of integer and boolean type, these types are not capable of storing missing data. Until we can switch to using a native NA type in NumPy, we’ve established some “casting rules” when reindexing will cause missing data to be introduced into, say, a Series or DataFrame. Here they are:
| data type | Cast to |
|---|---|
| integer | float |
| boolean | object |
| float | no cast |
| object | no cast |
For example:
In [72]: s = Series(randn(5), index=[0, 2, 4, 6, 7])

In [73]: s > 0

0    False
2     True
4     True
6     True
7    False
dtype: bool

In [74]: (s > 0).dtype
dtype('bool')

In [75]: crit = (s > 0).reindex(range(8))

In [76]: crit

0    False
1      NaN
2     True
3      NaN
4     True
5      NaN
6     True
7    False
dtype: object

In [77]: crit.dtype
dtype('O')
Ordinarily NumPy will complain if you try to use an object array (even if it contains boolean values) instead of a boolean array to get or set values from an ndarray (e.g. selecting values based on some criteria). If a boolean vector contains NAs, an exception will be generated:
In [78]: reindexed = s.reindex(range(8)).fillna(0)

In [79]: reindexed[crit]
---------------------------------------------------------------------------
ValueError                                Traceback (most recent call last)
<ipython-input-79-2da204ed1ac7> in <module>()
----> 1 reindexed[crit]
/home/docbuild/CI/pandas/pandas/core/series.pyc in __getitem__(self, key)
    636         # special handling of boolean data with NAs stored in object
    637         # arrays. Since we can't represent NA with dtype=bool
--> 638         if _is_bool_indexer(key):
    639             key = _check_bool_indexer(self.index, key)
    640
/home/docbuild/CI/pandas/pandas/core/common.pyc in _is_bool_indexer(key)
   1236         if not lib.is_bool_array(key):
   1237             if isnull(key).any():
-> 1238                 raise ValueError('cannot index with vector containing '
   1239                                  'NA / NaN values')
   1240             return False
ValueError: cannot index with vector containing NA / NaN values
However, these can be filled in using fillna and it will work fine:
In [80]: reindexed[crit.fillna(False)]

2    1.063327
4    1.266143
6    0.299368
dtype: float64

In [81]: reindexed[crit.fillna(True)]

1    0.000000
2    1.063327
3    0.000000
4    1.266143
5    0.000000
6    0.299368
dtype: float64