pandas.plotting.lag_plot#
- pandas.plotting.lag_plot(series, lag=1, ax=None, **kwds)[source]#
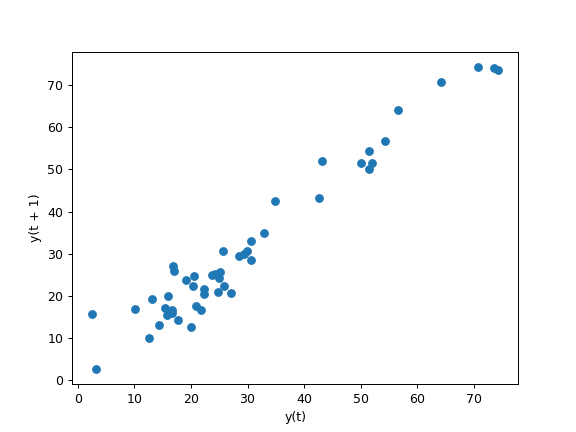
Lag plot for time series.
A lag plot is a scatter plot of a time series against a lag of itself. It helps in visualizing the temporal dependence between observations by plotting the values at time t on the x-axis and the values at time t + lag on the y-axis.
- Parameters:
- seriesSeries
The time series to visualize.
- lagint, default 1
Lag length of the scatter plot.
- axMatplotlib axis object, optional
The matplotlib axis object to use.
- **kwds
Matplotlib scatter method keyword arguments.
- Returns:
- matplotlib.axes.Axes
The matplotlib Axes object containing the lag plot.
See also
plotting.autocorrelation_plotAutocorrelation plot for time series.
matplotlib.pyplot.scatterA scatter plot of y vs. x with varying marker size and/or color in Matplotlib.
Examples
Lag plots are most commonly used to look for patterns in time series data.
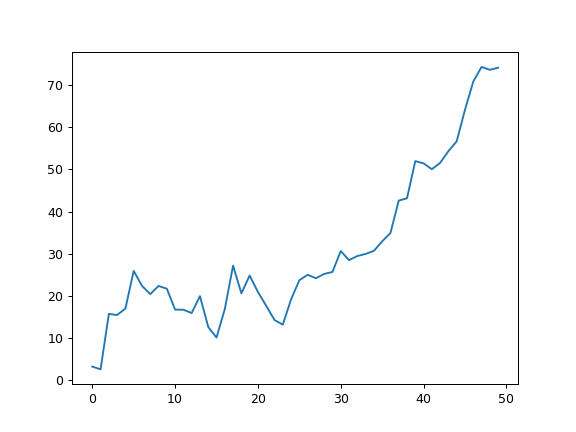
Given the following time series
>>> np.random.seed(5)
>>> x = np.cumsum(np.random.normal(loc=1, scale=5, size=50))
>>> s = pd.Series(x)
>>> s.plot()
A lag plot with
lag=1returns>>> _ = pd.plotting.lag_plot(s, lag=1)