pandas.io.formats.style.Styler.highlight_quantile
-
Styler.highlight_quantile(subset=None, color='yellow', axis=0, q_left=0.0, q_right=1.0, interpolation='linear', inclusive='both', props=None)[source]¶ Highlight values defined by a quantile with a style.
New in version 1.3.0.
- Parameters
- subsetlabel, array-like, IndexSlice, optional
A valid 2d input to DataFrame.loc[<subset>], or, in the case of a 1d input or single key, to DataFrame.loc[:, <subset>] where the columns are prioritised, to limit
datato before applying the function.- colorstr, default ‘yellow’
Background color to use for highlighting
- axis{0 or ‘index’, 1 or ‘columns’, None}, default 0
Axis along which to determine and highlight quantiles. If
Nonequantiles are measured over the entire DataFrame. See examples.- q_leftfloat, default 0
Left bound, in [0, q_right), for the target quantile range.
- q_rightfloat, default 1
Right bound, in (q_left, 1], for the target quantile range.
- interpolation{‘linear’, ‘lower’, ‘higher’, ‘midpoint’, ‘nearest’}
Argument passed to
Series.quantileorDataFrame.quantilefor quantile estimation.- inclusive{‘both’, ‘neither’, ‘left’, ‘right’}
Identify whether quantile bounds are closed or open.
- propsstr, default None
CSS properties to use for highlighting. If
propsis given,coloris not used.
- Returns
- selfStyler
See also
Styler.highlight_nullHighlight missing values with a style.
Styler.highlight_maxHighlight the maximum with a style.
Styler.highlight_minHighlight the minimum with a style.
Styler.highlight_betweenHighlight a defined range with a style.
Notes
This function does not work with
strdtypes.Examples
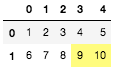
Using
axis=Noneand apply a quantile to all collective data>>> df = pd.DataFrame(np.arange(10).reshape(2,5) + 1) >>> df.style.highlight_quantile(axis=None, q_left=0.8, color="#fffd75")
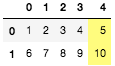
Or highlight quantiles row-wise or column-wise, in this case by row-wise
>>> df.style.highlight_quantile(axis=1, q_left=0.8, color="#fffd75")
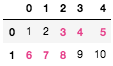
Use
propsinstead of default background coloring>>> df.style.highlight_quantile(axis=None, q_left=0.2, q_right=0.8, ... props='font-weight:bold;color:#e83e8c')