pandas.plotting.bootstrap_plot
- pandas.plotting.bootstrap_plot(series, fig=None, size=50, samples=500, **kwds)[source]
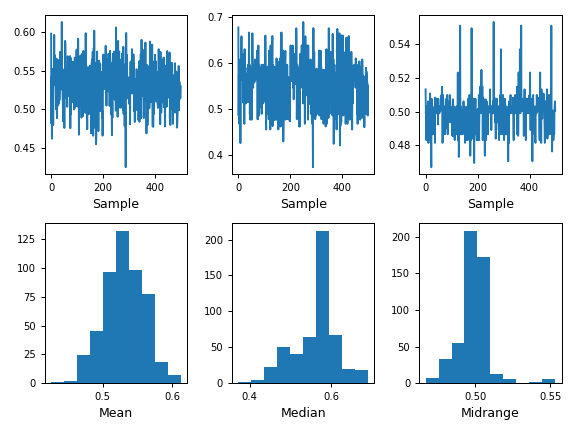
Bootstrap plot on mean, median and mid-range statistics.
The bootstrap plot is used to estimate the uncertainty of a statistic by relaying on random sampling with replacement [1]. This function will generate bootstrapping plots for mean, median and mid-range statistics for the given number of samples of the given size.
- 1
“Bootstrapping (statistics)” in https://en.wikipedia.org/wiki/Bootstrapping_%28statistics%29
- Parameters
- seriespandas.Series
Series from where to get the samplings for the bootstrapping.
- figmatplotlib.figure.Figure, default None
If given, it will use the fig reference for plotting instead of creating a new one with default parameters.
- sizeint, default 50
Number of data points to consider during each sampling. It must be less than or equal to the length of the series.
- samplesint, default 500
Number of times the bootstrap procedure is performed.
- **kwds
Options to pass to matplotlib plotting method.
- Returns
- matplotlib.figure.Figure
Matplotlib figure.
See also
DataFrame.plotBasic plotting for DataFrame objects.
Series.plotBasic plotting for Series objects.
Examples
This example draws a basic bootstrap plot for a Series.
>>> s = pd.Series(np.random.uniform(size=100))
>>> pd.plotting.bootstrap_plot(s)
<Figure size 640x480 with 6 Axes>