pandas.plotting.lag_plot#
- pandas.plotting.lag_plot(series, lag=1, ax=None, **kwds)[source]#
Lag plot for time series.
- Parameters
- seriesTime series
- laglag of the scatter plot, default 1
- axMatplotlib axis object, optional
- **kwds
Matplotlib scatter method keyword arguments.
- Returns
- class:matplotlib.axis.Axes
Examples
Lag plots are most commonly used to look for patterns in time series data.
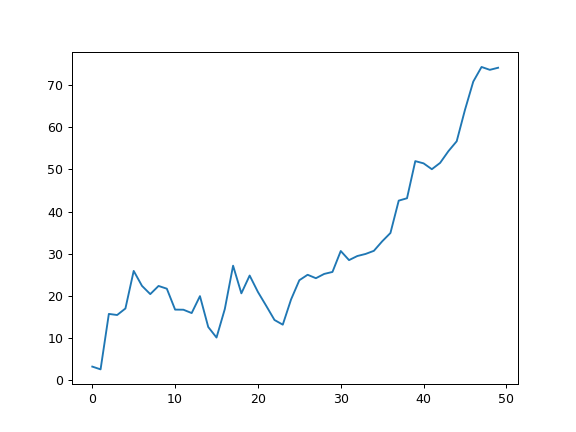
Given the following time series
>>> np.random.seed(5)
>>> x = np.cumsum(np.random.normal(loc=1, scale=5, size=50))
>>> s = pd.Series(x)
>>> s.plot()
<AxesSubplot: xlabel='Midrange'>
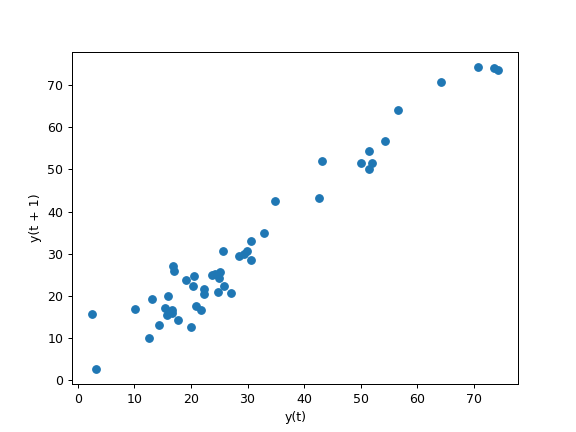
A lag plot with
lag=1returns>>> pd.plotting.lag_plot(s, lag=1) <AxesSubplot: xlabel='y(t)', ylabel='y(t + 1)'>