pandas.plotting.parallel_coordinates#
- pandas.plotting.parallel_coordinates(frame, class_column, cols=None, ax=None, color=None, use_columns=False, xticks=None, colormap=None, axvlines=True, axvlines_kwds=None, sort_labels=False, **kwargs)[source]#
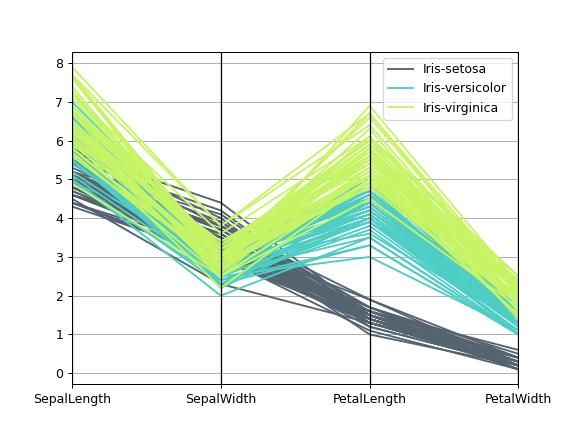
Parallel coordinates plotting.
- Parameters:
- frameDataFrame
- class_columnstr
Column name containing class names.
- colslist, optional
A list of column names to use.
- axmatplotlib.axis, optional
Matplotlib axis object.
- colorlist or tuple, optional
Colors to use for the different classes.
- use_columnsbool, optional
If true, columns will be used as xticks.
- xtickslist or tuple, optional
A list of values to use for xticks.
- colormapstr or matplotlib colormap, default None
Colormap to use for line colors.
- axvlinesbool, optional
If true, vertical lines will be added at each xtick.
- axvlines_kwdskeywords, optional
Options to be passed to axvline method for vertical lines.
- sort_labelsbool, default False
Sort class_column labels, useful when assigning colors.
- **kwargs
Options to pass to matplotlib plotting method.
- Returns:
- matplotlib.axes.Axes
Examples
>>> df = pd.read_csv(
...     'https://raw.githubusercontent.com/pandas-dev/'
...     'pandas/main/pandas/tests/io/data/csv/iris.csv'
... )
>>> pd.plotting.parallel_coordinates(
...     df, 'Name', color=('#556270', '#4ECDC4', '#C7F464')
... )