Frequently Asked Questions (FAQ)
Migrating from scikits.timeseries to pandas >= 0.8.0
Starting with pandas 0.8.0, users of scikits.timeseries should have all of the features that they need to migrate their code to use pandas. Portions of the scikits.timeseries codebase for implementing calendar logic and timespan frequency conversions (but not resampling, that has all been implemented from scratch from the ground up) have been ported to the pandas codebase.
The scikits.timeseries notions of Date and DateArray are responsible for implementing calendar logic:
In [16]: dt = ts.Date('Q', '1984Q3')

# sic
In [17]: dt
Out[17]: <Q-DEC : 1984Q1>

In [18]: dt.asfreq('D', 'start')
Out[18]: <D : 01-Jan-1984>

In [19]: dt.asfreq('D', 'end')
Out[19]: <D : 31-Mar-1984>

In [20]: dt + 3
Out[20]: <Q-DEC : 1984Q4>
Date and DateArray from scikits.timeseries have been reincarnated in pandas Period and PeriodIndex:
In [384]: pnow('D')  # scikits.timeseries.now()
Out[384]: Period('08-Nov-2012', 'D')

In [385]: Period(year=2007, month=3, day=15, freq='D')
Out[385]: Period('15-Mar-2007', 'D')

In [386]: p = Period('1984Q3')

In [387]: p
Out[387]: Period('1984Q3', 'Q-DEC')

In [388]: p.asfreq('D', 'start')
Out[388]: Period('01-Jul-1984', 'D')

In [389]: p.asfreq('D', 'end')
Out[389]: Period('30-Sep-1984', 'D')

In [390]: (p + 3).asfreq('T') + 6 * 60 + 30
Out[390]: Period('01-Jul-1985 06:29', 'T')

In [391]: rng = period_range('1990', '2010', freq='A')

In [392]: rng
Out[392]:
<class 'pandas.tseries.period.PeriodIndex'>
freq: A-DEC
[1990, ..., 2010]
length: 21

In [393]: rng.asfreq('B', 'end') - 3
Out[393]:
<class 'pandas.tseries.period.PeriodIndex'>
freq: B
[26-Dec-1990, ..., 28-Dec-2010]
length: 21
| scikits.timeseries | pandas | Notes |
|---|---|---|
| Date | Period | A span of time, from yearly through to secondly |
| DateArray | PeriodIndex | An array of timespans |
| convert | resample | Frequency conversion in scikits.timeseries |
| convert_to_annual | pivot_annual | currently supports up to daily frequency, see :issue:`736` |
PeriodIndex / DateArray properties and functions
The scikits.timeseries DateArray had a number of information properties. Here are the pandas equivalents:
| scikits.timeseries | pandas | Notes |
|---|---|---|
| get_steps | np.diff(idx.values) | |
| has_missing_dates | not idx.is_full | |
| is_full | idx.is_full | |
| is_valid | idx.is_monotonic and idx.is_unique | |
| is_chronological | is_monotonic | |
| arr.sort_chronologically() | idx.order() |
Frequency conversion
Frequency conversion is implemented using the resample method on TimeSeries and DataFrame objects (multiple time series). resample also works on panels (3D). Here is some code that resamples daily data to montly with scikits.timeseries:
In [394]: import scikits.timeseries as ts

In [395]: data = ts.time_series(np.random.randn(50), start_date='Jan-2000', freq='M')

In [396]: data
Out[396]:
timeseries([ 0.4691 -0.2829 -1.5091 -1.1356  1.2121 -0.1732  0.1192 -1.0442 -0.8618
 -2.1046 -0.4949  1.0718  0.7216 -0.7068 -1.0396  0.2719 -0.425   0.567
  0.2762 -1.0874 -0.6737  0.1136 -1.4784  0.525   0.4047  0.577  -1.715
 -1.0393 -0.3706 -1.1579 -1.3443  0.8449  1.0758 -0.109   1.6436 -1.4694
  0.357  -0.6746 -1.7769 -0.9689 -1.2945  0.4137  0.2767 -0.472  -0.014
 -0.3625 -0.0062 -0.9231  0.8957  0.8052],
   dates = [Jan-2012 ... Feb-2016],
   freq  = M)

In [397]: data.convert('A', func=np.mean)
Out[397]:
timeseries([-0.394509620575 -0.24462765889 -0.221632512996 -0.453772693384
 0.8504806638],
   dates = [2012 ... 2016],
   freq  = A-DEC)
Here is the equivalent pandas code:
In [398]: rng = period_range('Jan-2000', periods=50, freq='M')

In [399]: data = Series(np.random.randn(50), index=rng)

In [400]: data
Out[400]:
Jan-2000   -1.206412
Feb-2000    2.565646
Mar-2000    1.431256
Apr-2000    1.340309
May-2000   -1.170299
Jun-2000   -0.226169
Jul-2000    0.410835
Aug-2000    0.813850
Sep-2000    0.132003
Oct-2000   -0.827317
Nov-2000   -0.076467
Dec-2000   -1.187678
Jan-2001    1.130127
Feb-2001   -1.436737
Mar-2001   -1.413681
Apr-2001    1.607920
May-2001    1.024180
Jun-2001    0.569605
Jul-2001    0.875906
Aug-2001   -2.211372
Sep-2001    0.974466
Oct-2001   -2.006747
Nov-2001   -0.410001
Dec-2001   -0.078638
Jan-2002    0.545952
Feb-2002   -1.219217
Mar-2002   -1.226825
Apr-2002    0.769804
May-2002   -1.281247
Jun-2002   -0.727707
Jul-2002   -0.121306
Aug-2002   -0.097883
Sep-2002    0.695775
Oct-2002    0.341734
Nov-2002    0.959726
Dec-2002   -1.110336
Jan-2003   -0.619976
Feb-2003    0.149748
Mar-2003   -0.732339
Apr-2003    0.687738
May-2003    0.176444
Jun-2003    0.403310
Jul-2003   -0.154951
Aug-2003    0.301624
Sep-2003   -2.179861
Oct-2003   -1.369849
Nov-2003   -0.954208
Dec-2003    1.462696
Jan-2004   -1.743161
Feb-2004   -0.826591
Freq: M

In [401]: data.resample('A', how=np.mean)
Out[401]:
2000    0.166630
2001   -0.114581
2002   -0.205961
2003   -0.235802
2004   -1.284876
Freq: A-DEC
Plotting
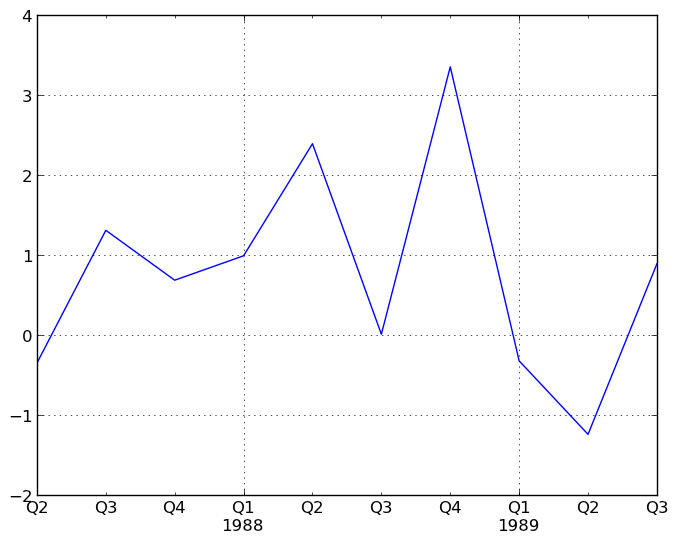
Much of the plotting functionality of scikits.timeseries has been ported and adopted to pandas’s data structures. For example:
In [402]: rng = period_range('1987Q2', periods=10, freq='Q-DEC')

In [403]: data = Series(np.random.randn(10), index=rng)

In [404]: plt.figure(); data.plot()
Out[404]: <matplotlib.axes.AxesSubplot at 0x1132f8290>
Converting to and from period format
Use the to_timestamp and to_period instance methods.
Treatment of missing data
Unlike scikits.timeseries, pandas data structures are not based on NumPy’s MaskedArray object. Missing data is represented as NaN in numerical arrays and either as None or NaN in non-numerical arrays. Implementing a version of pandas’s data structures that use MaskedArray is possible but would require the involvement of a dedicated maintainer. Active pandas developers are not interested in this.
Resampling with timestamps and periods
resample has a kind argument which allows you to resample time series with a DatetimeIndex to PeriodIndex:
In [405]: rng = date_range('1/1/2000', periods=200, freq='D')

In [406]: data = Series(np.random.randn(200), index=rng)

In [407]: data[:10]
Out[407]:
2000-01-01   -0.487602
2000-01-02   -0.082240
2000-01-03   -2.182937
2000-01-04    0.380396
2000-01-05    0.084844
2000-01-06    0.432390
2000-01-07    1.519970
2000-01-08   -0.493662
2000-01-09    0.600178
2000-01-10    0.274230
Freq: D

In [408]: data.index
Out[408]:
<class 'pandas.tseries.index.DatetimeIndex'>
[2000-01-01 00:00:00, ..., 2000-07-18 00:00:00]
Length: 200, Freq: D, Timezone: None

In [409]: data.resample('M', kind='period')
Out[409]:
Jan-2000    0.163775
Feb-2000    0.026549
Mar-2000   -0.089563
Apr-2000   -0.079405
May-2000    0.160348
Jun-2000    0.101725
Jul-2000   -0.708770
Freq: M
Similarly, resampling from periods to timestamps is possible with an optional interval ('start' or 'end') convention:
In [410]: rng = period_range('Jan-2000', periods=50, freq='M')

In [411]: data = Series(np.random.randn(50), index=rng)

In [412]: resampled = data.resample('A', kind='timestamp', convention='end')

In [413]: resampled.index
Out[413]:
<class 'pandas.tseries.index.DatetimeIndex'>
[2000-12-31 00:00:00, ..., 2004-12-31 00:00:00]
Length: 5, Freq: A-DEC, Timezone: None