
pandas.plotting.andrews_curves#
- pandas.plotting.andrews_curves(frame, class_column, ax=None, samples=200, color=None, colormap=None, **kwargs)[source]#
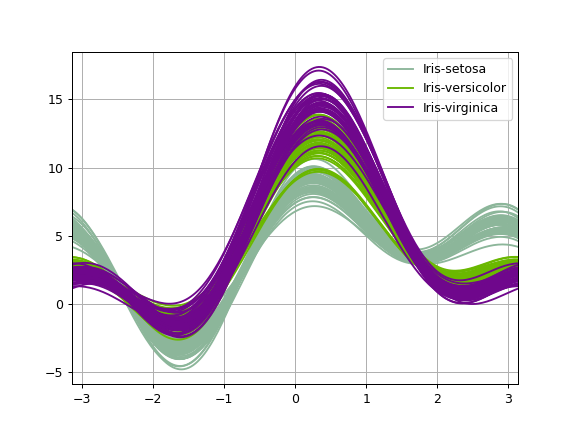
Generate a matplotlib plot for visualizing clusters of multivariate data.
Andrews curves have the functional form:
\[f(t) = \frac{x_1}{\sqrt{2}} + x_2 \sin(t) + x_3 \cos(t) + x_4 \sin(2t) + x_5 \cos(2t) + \cdots\]Where \(x\) coefficients correspond to the values of each dimension and \(t\) is linearly spaced between \(-\pi\) and \(+\pi\). Each row of frame then corresponds to a single curve.
- Parameters:
- frameDataFrame
Data to be plotted, preferably normalized to (0.0, 1.0).
- class_columnlabel
Name of the column containing class names.
- axaxes object, default None
Axes to use.
- samplesint
Number of points to plot in each curve.
- colorstr, list[str] or tuple[str], optional
Colors to use for the different classes. Colors can be strings or 3-element floating point RGB values.
- colormapstr or matplotlib colormap object, default None
Colormap to select colors from. If a string, load colormap with that name from matplotlib.
- **kwargs
Options to pass to matplotlib plotting method.
- Returns:
matplotlib.axes.AxesThe matplotlib Axes object with the plot.
See also
plotting.parallel_coordinatesPlot parallel coordinates chart.
DataFrame.plotMake plots of Series or DataFrame.
Examples
>>> df = pd.DataFrame(
...     {
...         "SepalLength": [6.5, 7.7, 5.1, 5.8, 7.6, 5.0, 5.4, 4.6, 6.7, 4.6],
...         "SepalWidth": [3.0, 3.8, 3.8, 2.7, 3.0, 2.3, 3.0, 3.2, 3.3, 3.6],
...         "PetalLength": [5.5, 6.7, 1.9, 5.1, 6.6, 3.3, 4.5, 1.4, 5.7, 1.0],
...         "PetalWidth": [1.8, 2.2, 0.4, 1.9, 2.1, 1.0, 1.5, 0.2, 2.1, 0.2],
...         "Name": [
...             "virginica",
...             "virginica",
...             "setosa",
...             "virginica",
...             "virginica",
...             "versicolor",
...             "versicolor",
...             "setosa",
...             "virginica",
...             "setosa",
...         ],
...     }
... )
>>> pd.plotting.andrews_curves(df, "Name")