pandas.plotting.plot_params#
- pandas.plotting.plot_params = {'xaxis.compat': False}#
Stores pandas plotting options.
Allows for parameter aliasing so you can just use parameter names that are the same as the plot function parameters, but is stored in a canonical format that makes it easy to breakdown into groups later.
See also
plotting.register_matplotlib_convertersRegister pandas formatters and converters with matplotlib.
plotting.bootstrap_plotBootstrap plot on mean, median and mid-range statistics.
plotting.autocorrelation_plotAutocorrelation plot for time series.
plotting.lag_plotLag plot for time series.
Examples
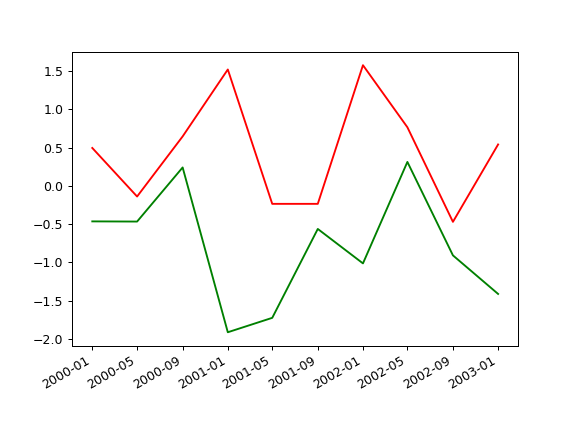
>>> np.random.seed(42)
>>> df = pd.DataFrame(
...     {"A": np.random.randn(10), "B": np.random.randn(10)},
...     index=pd.date_range("1/1/2000", freq="4MS", periods=10),
... )
>>> with pd.plotting.plot_params.use("x_compat", True):
...     _ = df["A"].plot(color="r")
...     _ = df["B"].plot(color="g")