pandas.plotting.table#
- pandas.plotting.table(ax, data, **kwargs)[source]#
Helper function to convert DataFrame and Series to matplotlib.table.
This method provides an easy way to visualize tabular data within a Matplotlib figure. It automatically extracts index and column labels from the DataFrame or Series, unless explicitly specified. This function is particularly useful when displaying summary tables alongside other plots or when creating static reports. It utilizes the matplotlib.pyplot.table backend and allows customization through various styling options available in Matplotlib.
- Parameters:
- axMatplotlib axes object
The axes on which to draw the table.
- dataDataFrame or Series
Data for table contents.
- **kwargs
Keyword arguments to be passed to matplotlib.table.table. If rowLabels or colLabels is not specified, data index or column names will be used.
- Returns:
- matplotlib table object
The created table as a matplotlib Table object.
See also
DataFrame.plotMake plots of DataFrame using matplotlib.
matplotlib.pyplot.tableCreate a table from data in a Matplotlib plot.
Examples
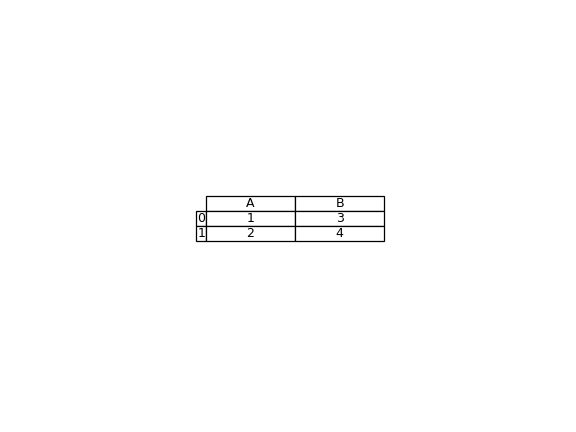
>>> import matplotlib.pyplot as plt
>>> df = pd.DataFrame({"A": [1, 2], "B": [3, 4]})
>>> fig, ax = plt.subplots()
>>> ax.axis("off")
(np.float64(0.0), np.float64(1.0), np.float64(0.0), np.float64(1.0))
>>> table = pd.plotting.table(
...     ax, df, loc="center", cellLoc="center", colWidths=[0.2, 0.2]
... )