Working with missing data
In this section, we will discuss missing (also referred to as NA) values in pandas.
Note
The choice of using NaN internally to denote missing data was largely
for simplicity and performance reasons. It differs from the MaskedArray
approach of, for example, scikits.timeseries. We are hopeful that
NumPy will soon be able to provide a native NA type solution (similar to R)
performant enough to be used in pandas.
See the cookbook for some advanced strategies.
Missing data basics
When / why does data become missing?
Some might quibble over our usage of missing. By “missing” we simply mean NA (“not available”) or “not present for whatever reason”. Many data sets simply arrive with missing data, either because it exists and was not collected or it never existed. For example, in a collection of financial time series, some of the time series might start on different dates. Thus, values prior to the start date would generally be marked as missing.
In pandas, one of the most common ways that missing data is introduced into a data set is by reindexing. For example:
In [1]: df = pd.DataFrame(np.random.randn(5, 3), index=['a', 'c', 'e', 'f', 'h'],
   ...:                   columns=['one', 'two', 'three'])
   ...:

In [2]: df['four'] = 'bar'

In [3]: df['five'] = df['one'] > 0

In [4]: df
Out[4]:
        one       two     three four   five
a -0.166778  0.501113 -0.355322  bar  False
c -0.337890  0.580967  0.983801  bar  False
e  0.057802  0.761948 -0.712964  bar   True
f -0.443160 -0.974602  1.047704  bar  False
h -0.717852 -1.053898 -0.019369  bar  False

In [5]: df2 = df.reindex(['a', 'b', 'c', 'd', 'e', 'f', 'g', 'h'])

In [6]: df2
Out[6]:
        one       two     three four   five
a -0.166778  0.501113 -0.355322  bar  False
b       NaN       NaN       NaN  NaN    NaN
c -0.337890  0.580967  0.983801  bar  False
d       NaN       NaN       NaN  NaN    NaN
e  0.057802  0.761948 -0.712964  bar   True
f -0.443160 -0.974602  1.047704  bar  False
g       NaN       NaN       NaN  NaN    NaN
h -0.717852 -1.053898 -0.019369  bar  False
Values considered “missing”
As data comes in many shapes and forms, pandas aims to be flexible with regard
to handling missing data. While NaN is the default missing value marker for
reasons of computational speed and convenience, we need to be able to easily
detect this value with data of different types: floating point, integer,
boolean, and general object. In many cases, however, the Python None will
arise and we wish to also consider that “missing” or “not available” or “NA”.
Note
If you want to consider inf and -inf to be “NA” in computations,
you can set pandas.options.mode.use_inf_as_na = True.
To make detecting missing values easier (and across different array dtypes),
pandas provides the isna() and
notna() functions, which are also methods on
Series and DataFrame objects:
In [7]: df2['one']
Out[7]:
a -0.166778
b NaN
c -0.337890
d NaN
e 0.057802
f -0.443160
g NaN
h -0.717852
Name: one, dtype: float64
In [8]: pd.isna(df2['one'])
���������������������������������������������������������������������������������������������������������������������������������������������������Out[8]:
a False
b True
c False
d True
e False
f False
g True
h False
Name: one, dtype: bool
In [9]: df2['four'].notna()
���������������������������������������������������������������������������������������������������������������������������������������������������������������������������������������������������������������������������������������������������������������������������Out[9]:
a True
b False
c True
d False
e True
f True
g False
h True
Name: four, dtype: bool
In [10]: df2.isna()
����������������������������������������������������������������������������������������������������������������������������������������������������������������������������������������������������������������������������������������������������������������������������������������������������������������������������������������������������������������������������������������������������Out[10]:
one two three four five
a False False False False False
b True True True True True
c False False False False False
d True True True True True
e False False False False False
f False False False False False
g True True True True True
h False False False False False
Warning
One has to be mindful that in Python (and NumPy), the nan's don’t compare equal, but None's do.
Note that pandas/NumPy uses the fact that np.nan != np.nan, and treats None like np.nan.
In [11]: None == None
Out[11]: True
In [12]: np.nan == np.nan
��������������Out[12]: False
So as compared to above, a scalar equality comparison versus a None/np.nan doesn’t provide useful information.
In [13]: df2['one'] == np.nan
Out[13]:
a    False
b    False
c    False
d    False
e    False
f    False
g    False
h    False
Name: one, dtype: bool
Datetimes
For datetime64[ns] types, NaT represents missing values. This is a pseudo-native
sentinel value that can be represented by NumPy in a singular dtype (datetime64[ns]).
pandas objects provide intercompatibility between NaT and NaN.
In [14]: df2 = df.copy()
In [15]: df2['timestamp'] = pd.Timestamp('20120101')
In [16]: df2
Out[16]:
one two three four five timestamp
a -0.166778 0.501113 -0.355322 bar False 2012-01-01
c -0.337890 0.580967 0.983801 bar False 2012-01-01
e 0.057802 0.761948 -0.712964 bar True 2012-01-01
f -0.443160 -0.974602 1.047704 bar False 2012-01-01
h -0.717852 -1.053898 -0.019369 bar False 2012-01-01
In [17]: df2.loc[['a','c','h'],['one','timestamp']] = np.nan
In [18]: df2
Out[18]:
one two three four five timestamp
a NaN 0.501113 -0.355322 bar False NaT
c NaN 0.580967 0.983801 bar False NaT
e 0.057802 0.761948 -0.712964 bar True 2012-01-01
f -0.443160 -0.974602 1.047704 bar False 2012-01-01
h NaN -1.053898 -0.019369 bar False NaT
In [19]: df2.get_dtype_counts()
����������������������������������������������������������������������������������������������������������������������������������������������������������������������������������������������������������������������������������������������������������������������������������������������������������������������������������������������������Out[19]:
float64 3
object 1
bool 1
datetime64[ns] 1
dtype: int64
Inserting missing data
You can insert missing values by simply assigning to containers. The actual missing value used will be chosen based on the dtype.
For example, numeric containers will always use NaN regardless of
the missing value type chosen:
In [20]: s = pd.Series([1, 2, 3])

In [21]: s.loc[0] = None

In [22]: s
Out[22]:
0    NaN
1    2.0
2    3.0
dtype: float64
Likewise, datetime containers will always use NaT.
For object containers, pandas will use the value given:
In [23]: s = pd.Series(["a", "b", "c"])

In [24]: s.loc[0] = None

In [25]: s.loc[1] = np.nan

In [26]: s
Out[26]:
0    None
1     NaN
2       c
dtype: object
Calculations with missing data
Missing values propagate naturally through arithmetic operations between pandas objects.
In [27]: a
Out[27]:
one two
a NaN 0.501113
c NaN 0.580967
e 0.057802 0.761948
f -0.443160 -0.974602
h -0.443160 -1.053898
In [28]: b
����������������������������������������������������������������������������������������������������������������������������������������������Out[28]:
one two three
a NaN 0.501113 -0.355322
c NaN 0.580967 0.983801
e 0.057802 0.761948 -0.712964
f -0.443160 -0.974602 1.047704
h NaN -1.053898 -0.019369
In [29]: a + b
��������������������������������������������������������������������������������������������������������������������������������������������������������������������������������������������������������������������������������������������������������������������������������������������������������������������������������������������������������Out[29]:
one three two
a NaN NaN 1.002226
c NaN NaN 1.161935
e 0.115604 NaN 1.523896
f -0.886321 NaN -1.949205
h NaN NaN -2.107796
The descriptive statistics and computational methods discussed in the data structure overview (and listed here and here) are all written to account for missing data. For example:
- When summing data, NA (missing) values will be treated as zero.
- If the data are all NA, the result will be 0.
- Cumulative methods like
cumsum()andcumprod()ignore NA values by default, but preserve them in the resulting arrays. To override this behaviour and include NA values, useskipna=False.
In [30]: df
Out[30]:
one two three
a NaN 0.501113 -0.355322
c NaN 0.580967 0.983801
e 0.057802 0.761948 -0.712964
f -0.443160 -0.974602 1.047704
h NaN -1.053898 -0.019369
In [31]: df['one'].sum()
����������������������������������������������������������������������������������������������������������������������������������������������������������������������������������������������������������Out[31]: -0.38535826528461409
In [32]: df.mean(1)
����������������������������������������������������������������������������������������������������������������������������������������������������������������������������������������������������������������������������������������Out[32]:
a 0.072895
c 0.782384
e 0.035595
f -0.123353
h -0.536633
dtype: float64
In [33]: df.cumsum()
���������������������������������������������������������������������������������������������������������������������������������������������������������������������������������������������������������������������������������������������������������������������������������������������������������������������������������������Out[33]:
one two three
a NaN 0.501113 -0.355322
c NaN 1.082080 0.628479
e 0.057802 1.844028 -0.084485
f -0.385358 0.869426 0.963219
h NaN -0.184472 0.943850
In [34]: df.cumsum(skipna=False)
�������������������������������������������������������������������������������������������������������������������������������������������������������������������������������������������������������������������������������������������������������������������������������������������������������������������������������������������������������������������������������������������������������������������������������������������������������������������������������������������������������������������������������������������������Out[34]:
one two three
a NaN 0.501113 -0.355322
c NaN 1.082080 0.628479
e NaN 1.844028 -0.084485
f NaN 0.869426 0.963219
h NaN -0.184472 0.943850
Sum/Prod of Empties/Nans
Warning
This behavior is now standard as of v0.22.0 and is consistent with the default in numpy; previously sum/prod of all-NA or empty Series/DataFrames would return NaN.
See v0.22.0 whatsnew for more.
The sum of an empty or all-NA Series or column of a DataFrame is 0.
In [35]: pd.Series([np.nan]).sum()
Out[35]: 0.0
In [36]: pd.Series([]).sum()
�������������Out[36]: 0.0
The product of an empty or all-NA Series or column of a DataFrame is 1.
In [37]: pd.Series([np.nan]).prod()
Out[37]: 1.0
In [38]: pd.Series([]).prod()
�������������Out[38]: 1.0
NA values in GroupBy
NA groups in GroupBy are automatically excluded. This behavior is consistent with R, for example:
In [39]: df
Out[39]:
one two three
a NaN 0.501113 -0.355322
c NaN 0.580967 0.983801
e 0.057802 0.761948 -0.712964
f -0.443160 -0.974602 1.047704
h NaN -1.053898 -0.019369
In [40]: df.groupby('one').mean()
����������������������������������������������������������������������������������������������������������������������������������������������������������������������������������������������������������Out[40]:
two three
one
-0.443160 -0.974602 1.047704
0.057802 0.761948 -0.712964
See the groupby section here for more information.
Cleaning / filling missing data
pandas objects are equipped with various data manipulation methods for dealing with missing data.
Filling missing values: fillna
fillna() can “fill in” NA values with non-NA data in a couple
of ways, which we illustrate:
Replace NA with a scalar value
In [41]: df2
Out[41]:
one two three four five timestamp
a NaN 0.501113 -0.355322 bar False NaT
c NaN 0.580967 0.983801 bar False NaT
e 0.057802 0.761948 -0.712964 bar True 2012-01-01
f -0.443160 -0.974602 1.047704 bar False 2012-01-01
h NaN -1.053898 -0.019369 bar False NaT
In [42]: df2.fillna(0)
����������������������������������������������������������������������������������������������������������������������������������������������������������������������������������������������������������������������������������������������������������������������������������������������������������������������������������������������������Out[42]:
one two three four five timestamp
a 0.000000 0.501113 -0.355322 bar False 0
c 0.000000 0.580967 0.983801 bar False 0
e 0.057802 0.761948 -0.712964 bar True 2012-01-01 00:00:00
f -0.443160 -0.974602 1.047704 bar False 2012-01-01 00:00:00
h 0.000000 -1.053898 -0.019369 bar False 0
In [43]: df2['one'].fillna('missing')
��������������������������������������������������������������������������������������������������������������������������������������������������������������������������������������������������������������������������������������������������������������������������������������������������������������������������������������������������������������������������������������������������������������������������������������������������������������������������������������������������������������������������������������������������������������������������������������������������������������������������������������������������������������������������������������������������������������������������������������������������������������������Out[43]:
a missing
c missing
e 0.057802
f -0.44316
h missing
Name: one, dtype: object
Fill gaps forward or backward
Using the same filling arguments as reindexing, we can propagate non-NA values forward or backward:
In [44]: df
Out[44]:
one two three
a NaN 0.501113 -0.355322
c NaN 0.580967 0.983801
e 0.057802 0.761948 -0.712964
f -0.443160 -0.974602 1.047704
h NaN -1.053898 -0.019369
In [45]: df.fillna(method='pad')
����������������������������������������������������������������������������������������������������������������������������������������������������������������������������������������������������������Out[45]:
one two three
a NaN 0.501113 -0.355322
c NaN 0.580967 0.983801
e 0.057802 0.761948 -0.712964
f -0.443160 -0.974602 1.047704
h -0.443160 -1.053898 -0.019369
Limit the amount of filling
If we only want consecutive gaps filled up to a certain number of data points, we can use the limit keyword:
In [46]: df
Out[46]:
one two three
a NaN 0.501113 -0.355322
c NaN 0.580967 0.983801
e NaN NaN NaN
f NaN NaN NaN
h NaN -1.053898 -0.019369
In [47]: df.fillna(method='pad', limit=1)
����������������������������������������������������������������������������������������������������������������������������������������������������������������������������Out[47]:
one two three
a NaN 0.501113 -0.355322
c NaN 0.580967 0.983801
e NaN 0.580967 0.983801
f NaN NaN NaN
h NaN -1.053898 -0.019369
To remind you, these are the available filling methods:
| Method | Action |
|---|---|
| pad / ffill | Fill values forward |
| bfill / backfill | Fill values backward |
With time series data, using pad/ffill is extremely common so that the “last known value” is available at every time point.
ffill() is equivalent to fillna(method='ffill')
and bfill() is equivalent to fillna(method='bfill')
Filling with a PandasObject
You can also fillna using a dict or Series that is alignable. The labels of the dict or index of the Series must match the columns of the frame you wish to fill. The use case of this is to fill a DataFrame with the mean of that column.
In [48]: dff = pd.DataFrame(np.random.randn(10,3), columns=list('ABC'))
In [49]: dff.iloc[3:5,0] = np.nan
In [50]: dff.iloc[4:6,1] = np.nan
In [51]: dff.iloc[5:8,2] = np.nan
In [52]: dff
Out[52]:
A B C
0 0.758887 2.340598 0.219039
1 -1.235583 0.031785 0.701683
2 -1.557016 -0.636986 -1.238610
3 NaN -1.002278 0.654052
4 NaN NaN 1.053999
5 0.651981 NaN NaN
6 0.109001 -0.533294 NaN
7 -1.037831 -1.150016 NaN
8 -0.687693 1.921056 -0.121113
9 -0.258742 -0.706329 0.402547
In [53]: dff.fillna(dff.mean())
��������������������������������������������������������������������������������������������������������������������������������������������������������������������������������������������������������������������������������������������������������������������������������������������������������������������������������������������������������������������������Out[53]:
A B C
0 0.758887 2.340598 0.219039
1 -1.235583 0.031785 0.701683
2 -1.557016 -0.636986 -1.238610
3 -0.407125 -1.002278 0.654052
4 -0.407125 0.033067 1.053999
5 0.651981 0.033067 0.238800
6 0.109001 -0.533294 0.238800
7 -1.037831 -1.150016 0.238800
8 -0.687693 1.921056 -0.121113
9 -0.258742 -0.706329 0.402547
In [54]: dff.fillna(dff.mean()['B':'C'])
����������������������������������������������������������������������������������������������������������������������������������������������������������������������������������������������������������������������������������������������������������������������������������������������������������������������������������������������������������������������������������������������������������������������������������������������������������������������������������������������������������������������������������������������������������������������������������������������������������������������������������������������������������������������������������������������������������������������������������������������������Out[54]:
A B C
0 0.758887 2.340598 0.219039
1 -1.235583 0.031785 0.701683
2 -1.557016 -0.636986 -1.238610
3 NaN -1.002278 0.654052
4 NaN 0.033067 1.053999
5 0.651981 0.033067 0.238800
6 0.109001 -0.533294 0.238800
7 -1.037831 -1.150016 0.238800
8 -0.687693 1.921056 -0.121113
9 -0.258742 -0.706329 0.402547
Same result as above, but is aligning the ‘fill’ value which is a Series in this case.
In [55]: dff.where(pd.notna(dff), dff.mean(), axis='columns')
Out[55]:
          A         B         C
0  0.758887  2.340598  0.219039
1 -1.235583  0.031785  0.701683
2 -1.557016 -0.636986 -1.238610
3 -0.407125 -1.002278  0.654052
4 -0.407125  0.033067  1.053999
5  0.651981  0.033067  0.238800
6  0.109001 -0.533294  0.238800
7 -1.037831 -1.150016  0.238800
8 -0.687693  1.921056 -0.121113
9 -0.258742 -0.706329  0.402547
Dropping axis labels with missing data: dropna
You may wish to simply exclude labels from a data set which refer to missing
data. To do this, use dropna():
In [56]: df
Out[56]:
one two three
a NaN 0.501113 -0.355322
c NaN 0.580967 0.983801
e NaN 0.000000 0.000000
f NaN 0.000000 0.000000
h NaN -1.053898 -0.019369
In [57]: df.dropna(axis=0)
����������������������������������������������������������������������������������������������������������������������������������������������������������������������������Out[57]:
Empty DataFrame
Columns: [one, two, three]
Index: []
In [58]: df.dropna(axis=1)
�������������������������������������������������������������������������������������������������������������������������������������������������������������������������������������������������������������������������������������������Out[58]:
two three
a 0.501113 -0.355322
c 0.580967 0.983801
e 0.000000 0.000000
f 0.000000 0.000000
h -1.053898 -0.019369
In [59]: df['one'].dropna()
�����������������������������������������������������������������������������������������������������������������������������������������������������������������������������������������������������������������������������������������������������������������������������������������������������������������������������������������������������������������������������������������Out[59]: Series([], Name: one, dtype: float64)
An equivalent dropna() is available for Series.
DataFrame.dropna has considerably more options than Series.dropna, which can be
examined in the API.
Interpolation
New in version 0.21.0: The limit_area keyword argument was added.
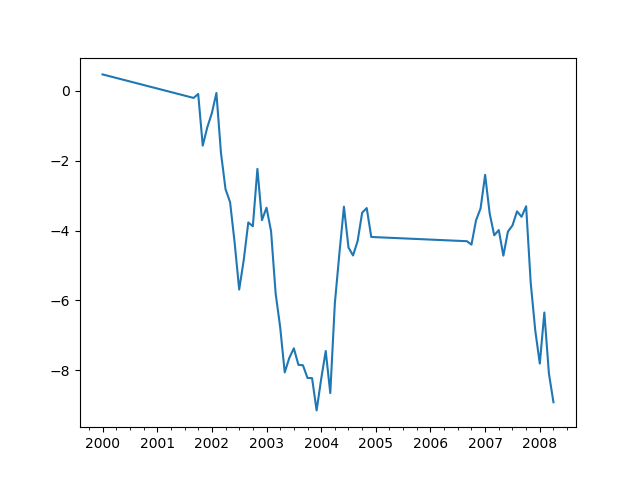
Both Series and DataFrame objects have interpolate()
that, by default, performs linear interpolation at missing datapoints.
In [60]: ts
Out[60]:
2000-01-31 0.469112
2000-02-29 NaN
2000-03-31 NaN
2000-04-28 NaN
2000-05-31 NaN
2000-06-30 NaN
2000-07-31 NaN
...
2007-10-31 -3.305259
2007-11-30 -5.485119
2007-12-31 -6.854968
2008-01-31 -7.809176
2008-02-29 -6.346480
2008-03-31 -8.089641
2008-04-30 -8.916232
Freq: BM, Length: 100, dtype: float64
In [61]: ts.count()
���������������������������������������������������������������������������������������������������������������������������������������������������������������������������������������������������������������������������������������������������������������������������������������������������������������������������������������������������������������������������������������������������������Out[61]: 61
In [62]: ts.interpolate().count()
���������������������������������������������������������������������������������������������������������������������������������������������������������������������������������������������������������������������������������������������������������������������������������������������������������������������������������������������������������������������������������������������������������������������Out[62]: 100
In [63]: ts.interpolate().plot()
����������������������������������������������������������������������������������������������������������������������������������������������������������������������������������������������������������������������������������������������������������������������������������������������������������������������������������������������������������������������������������������������������������������������������������Out[63]: <matplotlib.axes._subplots.AxesSubplot at 0x1c34d584a8>
Index aware interpolation is available via the method keyword:
In [64]: ts2
Out[64]:
2000-01-31 0.469112
2000-02-29 NaN
2002-07-31 -5.689738
2005-01-31 NaN
2008-04-30 -8.916232
dtype: float64
In [65]: ts2.interpolate()
��������������������������������������������������������������������������������������������������������������������������������������������Out[65]:
2000-01-31 0.469112
2000-02-29 -2.610313
2002-07-31 -5.689738
2005-01-31 -7.302985
2008-04-30 -8.916232
dtype: float64
In [66]: ts2.interpolate(method='time')
����������������������������������������������������������������������������������������������������������������������������������������������������������������������������������������������������������������������������������������������������������������������������������������Out[66]:
2000-01-31 0.469112
2000-02-29 0.273272
2002-07-31 -5.689738
2005-01-31 -7.095568
2008-04-30 -8.916232
dtype: float64
For a floating-point index, use method='values':
In [67]: ser
Out[67]:
0.0 0.0
1.0 NaN
10.0 10.0
dtype: float64
In [68]: ser.interpolate()
����������������������������������������������������������������Out[68]:
0.0 0.0
1.0 5.0
10.0 10.0
dtype: float64
In [69]: ser.interpolate(method='values')
��������������������������������������������������������������������������������������������������������������������������������Out[69]:
0.0 0.0
1.0 1.0
10.0 10.0
dtype: float64
You can also interpolate with a DataFrame:
In [70]: df = pd.DataFrame({'A': [1, 2.1, np.nan, 4.7, 5.6, 6.8],
....: 'B': [.25, np.nan, np.nan, 4, 12.2, 14.4]})
....:
In [71]: df
Out[71]:
A B
0 1.0 0.25
1 2.1 NaN
2 NaN NaN
3 4.7 4.00
4 5.6 12.20
5 6.8 14.40
In [72]: df.interpolate()
������������������������������������������������������������������������������������������������������������Out[72]:
A B
0 1.0 0.25
1 2.1 1.50
2 3.4 2.75
3 4.7 4.00
4 5.6 12.20
5 6.8 14.40
The method argument gives access to fancier interpolation methods.
If you have scipy installed, you can pass the name of a 1-d interpolation routine to method.
You’ll want to consult the full scipy interpolation documentation and reference guide for details.
The appropriate interpolation method will depend on the type of data you are working with.
- If you are dealing with a time series that is growing at an increasing rate,
method='quadratic'may be appropriate. - If you have values approximating a cumulative distribution function,
then
method='pchip'should work well. - To fill missing values with goal of smooth plotting, consider
method='akima'.
Warning
These methods require scipy.
In [73]: df.interpolate(method='barycentric')
Out[73]:
A B
0 1.00 0.250
1 2.10 -7.660
2 3.53 -4.515
3 4.70 4.000
4 5.60 12.200
5 6.80 14.400
In [74]: df.interpolate(method='pchip')
��������������������������������������������������������������������������������������������������������������������������Out[74]:
A B
0 1.00000 0.250000
1 2.10000 0.672808
2 3.43454 1.928950
3 4.70000 4.000000
4 5.60000 12.200000
5 6.80000 14.400000
In [75]: df.interpolate(method='akima')
����������������������������������������������������������������������������������������������������������������������������������������������������������������������������������������������������������������������������������������������������������������������������������������������Out[75]:
A B
0 1.000000 0.250000
1 2.100000 -0.873316
2 3.406667 0.320034
3 4.700000 4.000000
4 5.600000 12.200000
5 6.800000 14.400000
When interpolating via a polynomial or spline approximation, you must also specify the degree or order of the approximation:
In [76]: df.interpolate(method='spline', order=2)
Out[76]:
A B
0 1.000000 0.250000
1 2.100000 -0.428598
2 3.404545 1.206900
3 4.700000 4.000000
4 5.600000 12.200000
5 6.800000 14.400000
In [77]: df.interpolate(method='polynomial', order=2)
���������������������������������������������������������������������������������������������������������������������������������������������������������������������������Out[77]:
A B
0 1.000000 0.250000
1 2.100000 -2.703846
2 3.451351 -1.453846
3 4.700000 4.000000
4 5.600000 12.200000
5 6.800000 14.400000
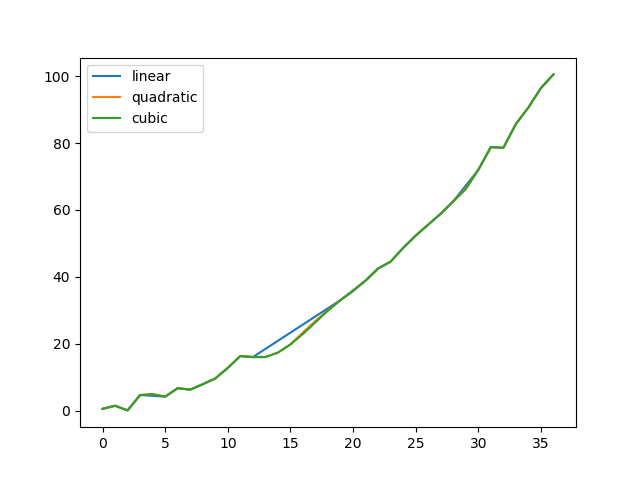
Compare several methods:
In [78]: np.random.seed(2)

In [79]: ser = pd.Series(np.arange(1, 10.1, .25)**2 + np.random.randn(37))

In [80]: bad = np.array([4, 13, 14, 15, 16, 17, 18, 20, 29])

In [81]: ser[bad] = np.nan

In [82]: methods = ['linear', 'quadratic', 'cubic']

In [83]: df = pd.DataFrame({m: ser.interpolate(method=m) for m in methods})

In [84]: df.plot()
Out[84]: <matplotlib.axes._subplots.AxesSubplot at 0x1c34dc9b38>
Another use case is interpolation at new values.
Suppose you have 100 observations from some distribution. And let’s suppose
that you’re particularly interested in what’s happening around the middle.
You can mix pandas’ reindex and interpolate methods to interpolate
at the new values.
In [85]: ser = pd.Series(np.sort(np.random.uniform(size=100)))

# interpolate at new_index
In [86]: new_index = ser.index | pd.Index([49.25, 49.5, 49.75, 50.25, 50.5, 50.75])

In [87]: interp_s = ser.reindex(new_index).interpolate(method='pchip')

In [88]: interp_s[49:51]
Out[88]:
49.00    0.471410
49.25    0.476841
49.50    0.481780
49.75    0.485998
50.00    0.489266
50.25    0.491814
50.50    0.493995
50.75    0.495763
51.00    0.497074
dtype: float64
Interpolation Limits
Like other pandas fill methods, interpolate() accepts a limit keyword
argument. Use this argument to limit the number of consecutive NaN values
filled since the last valid observation:
In [89]: ser = pd.Series([np.nan, np.nan, 5, np.nan, np.nan, np.nan, 13, np.nan, np.nan])
# fill all consecutive values in a forward direction
In [90]: ser.interpolate()
Out[90]:
0 NaN
1 NaN
2 5.0
3 7.0
4 9.0
5 11.0
6 13.0
7 13.0
8 13.0
dtype: float64
# fill one consecutive value in a forward direction
In [91]: ser.interpolate(limit=1)
�������������������������������������������������������������������������������������������������������������������Out[91]:
0 NaN
1 NaN
2 5.0
3 7.0
4 NaN
5 NaN
6 13.0
7 13.0
8 NaN
dtype: float64
By default, NaN values are filled in a forward direction. Use
limit_direction parameter to fill backward or from both directions.
# fill one consecutive value backwards
In [92]: ser.interpolate(limit=1, limit_direction='backward')
Out[92]:
0 NaN
1 5.0
2 5.0
3 NaN
4 NaN
5 11.0
6 13.0
7 NaN
8 NaN
dtype: float64
# fill one consecutive value in both directions
In [93]: ser.interpolate(limit=1, limit_direction='both')
�������������������������������������������������������������������������������������������������������������������Out[93]:
0 NaN
1 5.0
2 5.0
3 7.0
4 NaN
5 11.0
6 13.0
7 13.0
8 NaN
dtype: float64
# fill all consecutive values in both directions
In [94]: ser.interpolate(limit_direction='both')
��������������������������������������������������������������������������������������������������������������������������������������������������������������������������������������������������������������������������������������Out[94]:
0 5.0
1 5.0
2 5.0
3 7.0
4 9.0
5 11.0
6 13.0
7 13.0
8 13.0
dtype: float64
By default, NaN values are filled whether they are inside (surrounded by)
existing valid values, or outside existing valid values. Introduced in v0.23
the limit_area parameter restricts filling to either inside or outside values.
# fill one consecutive inside value in both directions
In [95]: ser.interpolate(limit_direction='both', limit_area='inside', limit=1)
Out[95]:
0 NaN
1 NaN
2 5.0
3 7.0
4 NaN
5 11.0
6 13.0
7 NaN
8 NaN
dtype: float64
# fill all consecutive outside values backward
In [96]: ser.interpolate(limit_direction='backward', limit_area='outside')
�������������������������������������������������������������������������������������������������������������������Out[96]:
0 5.0
1 5.0
2 5.0
3 NaN
4 NaN
5 NaN
6 13.0
7 NaN
8 NaN
dtype: float64
# fill all consecutive outside values in both directions
In [97]: ser.interpolate(limit_direction='both', limit_area='outside')
��������������������������������������������������������������������������������������������������������������������������������������������������������������������������������������������������������������������������������������Out[97]:
0 5.0
1 5.0
2 5.0
3 NaN
4 NaN
5 NaN
6 13.0
7 13.0
8 13.0
dtype: float64
Replacing Generic Values
Often times we want to replace arbitrary values with other values.
replace() in Series and replace() in DataFrame provides an efficient yet
flexible way to perform such replacements.
For a Series, you can replace a single value or a list of values by another value:
In [98]: ser = pd.Series([0., 1., 2., 3., 4.])

In [99]: ser.replace(0, 5)
Out[99]:
0    5.0
1    1.0
2    2.0
3    3.0
4    4.0
dtype: float64
You can replace a list of values by a list of other values:
In [100]: ser.replace([0, 1, 2, 3, 4], [4, 3, 2, 1, 0])
Out[100]:
0    4.0
1    3.0
2    2.0
3    1.0
4    0.0
dtype: float64
You can also specify a mapping dict:
In [101]: ser.replace({0: 10, 1: 100})
Out[101]:
0     10.0
1    100.0
2      2.0
3      3.0
4      4.0
dtype: float64
For a DataFrame, you can specify individual values by column:
In [102]: df = pd.DataFrame({'a': [0, 1, 2, 3, 4], 'b': [5, 6, 7, 8, 9]})

In [103]: df.replace({'a': 0, 'b': 5}, 100)
Out[103]:
     a    b
0  100  100
1    1    6
2    2    7
3    3    8
4    4    9
Instead of replacing with specified values, you can treat all given values as missing and interpolate over them:
In [104]: ser.replace([1, 2, 3], method='pad')
Out[104]:
0    0.0
1    0.0
2    0.0
3    0.0
4    4.0
dtype: float64
String/Regular Expression Replacement
Note
Python strings prefixed with the r character such as r'hello world'
are so-called “raw” strings. They have different semantics regarding
backslashes than strings without this prefix. Backslashes in raw strings
will be interpreted as an escaped backslash, e.g., r'\' == '\\'. You
should read about them
if this is unclear.
Replace the ‘.’ with NaN (str -> str):
In [105]: d = {'a': list(range(4)), 'b': list('ab..'), 'c': ['a', 'b', np.nan, 'd']}

In [106]: df = pd.DataFrame(d)

In [107]: df.replace('.', np.nan)
Out[107]:
   a    b    c
0  0    a    a
1  1    b    b
2  2  NaN  NaN
3  3  NaN    d
Now do it with a regular expression that removes surrounding whitespace (regex -> regex):
In [108]: df.replace(r'\s*\.\s*', np.nan, regex=True)
Out[108]:
   a    b    c
0  0    a    a
1  1    b    b
2  2  NaN  NaN
3  3  NaN    d
Replace a few different values (list -> list):
In [109]: df.replace(['a', '.'], ['b', np.nan])
Out[109]:
   a    b    c
0  0    b    b
1  1    b    b
2  2  NaN  NaN
3  3  NaN    d
list of regex -> list of regex:
In [110]: df.replace([r'\.', r'(a)'], ['dot', '\1stuff'], regex=True)
Out[110]:
   a       b       c
0  0  stuff  stuff
1  1       b       b
2  2     dot     NaN
3  3     dot       d
Only search in column 'b' (dict -> dict):
In [111]: df.replace({'b': '.'}, {'b': np.nan})
Out[111]:
   a    b    c
0  0    a    a
1  1    b    b
2  2  NaN  NaN
3  3  NaN    d
Same as the previous example, but use a regular expression for searching instead (dict of regex -> dict):
In [112]: df.replace({'b': r'\s*\.\s*'}, {'b': np.nan}, regex=True)
Out[112]:
   a    b    c
0  0    a    a
1  1    b    b
2  2  NaN  NaN
3  3  NaN    d
You can pass nested dictionaries of regular expressions that use regex=True:
In [113]: df.replace({'b': {'b': r''}}, regex=True)
Out[113]:
   a  b    c
0  0  a    a
1  1       b
2  2  .  NaN
3  3  .    d
Alternatively, you can pass the nested dictionary like so:
In [114]: df.replace(regex={'b': {r'\s*\.\s*': np.nan}})
Out[114]:
   a    b    c
0  0    a    a
1  1    b    b
2  2  NaN  NaN
3  3  NaN    d
You can also use the group of a regular expression match when replacing (dict of regex -> dict of regex), this works for lists as well.
In [115]: df.replace({'b': r'\s*(\.)\s*'}, {'b': r'\1ty'}, regex=True)
Out[115]:
   a    b    c
0  0    a    a
1  1    b    b
2  2  .ty  NaN
3  3  .ty    d
You can pass a list of regular expressions, of which those that match will be replaced with a scalar (list of regex -> regex).
In [116]: df.replace([r'\s*\.\s*', r'a|b'], np.nan, regex=True)
Out[116]:
   a   b    c
0  0 NaN  NaN
1  1 NaN  NaN
2  2 NaN  NaN
3  3 NaN    d
All of the regular expression examples can also be passed with the
to_replace argument as the regex argument. In this case the value
argument must be passed explicitly by name or regex must be a nested
dictionary. The previous example, in this case, would then be:
In [117]: df.replace(regex=[r'\s*\.\s*', r'a|b'], value=np.nan)
Out[117]:
   a   b    c
0  0 NaN  NaN
1  1 NaN  NaN
2  2 NaN  NaN
3  3 NaN    d
This can be convenient if you do not want to pass regex=True every time you
want to use a regular expression.
Note
Anywhere in the above replace examples that you see a regular expression
a compiled regular expression is valid as well.
Numeric Replacement
replace() is similar to fillna().
In [118]: df = pd.DataFrame(np.random.randn(10, 2))

In [119]: df[np.random.rand(df.shape[0]) > 0.5] = 1.5

In [120]: df.replace(1.5, np.nan)
Out[120]:
          0         1
0 -0.844214 -1.021415
1  0.432396 -0.323580
2  0.423825  0.799180
3  1.262614  0.751965
4       NaN       NaN
5       NaN       NaN
6 -0.498174 -1.060799
7  0.591667 -0.183257
8  1.019855 -1.482465
9       NaN       NaN
Replacing more than one value is possible by passing a list.
In [121]: df00 = df.values[0, 0]
In [122]: df.replace([1.5, df00], [np.nan, 'a'])
Out[122]:
0 1
0 a -1.02141
1 0.432396 -0.32358
2 0.423825 0.79918
3 1.26261 0.751965
4 NaN NaN
5 NaN NaN
6 -0.498174 -1.0608
7 0.591667 -0.183257
8 1.01985 -1.48247
9 NaN NaN
In [123]: df[1].dtype
�������������������������������������������������������������������������������������������������������������������������������������������������������������������������������������������������������������������������������������������������������������Out[123]: dtype('float64')
You can also operate on the DataFrame in place:
In [124]: df.replace(1.5, np.nan, inplace=True)
Warning
When replacing multiple bool or datetime64 objects, the first
argument to replace (to_replace) must match the type of the value
being replaced. For example,
s = pd.Series([True, False, True])
s.replace({'a string': 'new value', True: False})  # raises

TypeError: Cannot compare types 'ndarray(dtype=bool)' and 'str'
will raise a TypeError because one of the dict keys is not of the
correct type for replacement.
However, when replacing a single object such as,
In [125]: s = pd.Series([True, False, True])

In [126]: s.replace('a string', 'another string')
Out[126]:
0     True
1    False
2     True
dtype: bool
the original NDFrame object will be returned untouched. We’re working on
unifying this API, but for backwards compatibility reasons we cannot break
the latter behavior. See GH6354 for more details.
Missing data casting rules and indexing
While pandas supports storing arrays of integer and boolean type, these types are not capable of storing missing data. Until we can switch to using a native NA type in NumPy, we’ve established some “casting rules”. When a reindexing operation introduces missing data, the Series will be cast according to the rules introduced in the table below.
| data type | Cast to |
|---|---|
| integer | float |
| boolean | object |
| float | no cast |
| object | no cast |
For example:
In [127]: s = pd.Series(np.random.randn(5), index=[0, 2, 4, 6, 7])
In [128]: s > 0
Out[128]:
0 True
2 True
4 True
6 True
7 True
dtype: bool
In [129]: (s > 0).dtype
�������������������������������������������������������������������������Out[129]: dtype('bool')
In [130]: crit = (s > 0).reindex(list(range(8)))
In [131]: crit
Out[131]:
0 True
1 NaN
2 True
3 NaN
4 True
5 NaN
6 True
7 True
dtype: object
In [132]: crit.dtype
���������������������������������������������������������������������������������������������������������Out[132]: dtype('O')
Ordinarily NumPy will complain if you try to use an object array (even if it contains boolean values) instead of a boolean array to get or set values from an ndarray (e.g. selecting values based on some criteria). If a boolean vector contains NAs, an exception will be generated:
In [133]: reindexed = s.reindex(list(range(8))).fillna(0)

In [134]: reindexed[crit]
---------------------------------------------------------------------------
ValueError                                Traceback (most recent call last)
<ipython-input-134-0dac417a4890> in <module>()
----> 1 reindexed[crit]

~/sandbox/pandas-release/pandas-docs/pandas/core/series.py in __getitem__(self, key)
    805             key = list(key)
    806
--> 807         if com.is_bool_indexer(key):
    808             key = check_bool_indexer(self.index, key)
    809

~/sandbox/pandas-release/pandas-docs/pandas/core/common.py in is_bool_indexer(key)
    105             if not lib.is_bool_array(key):
    106                 if isna(key).any():
--> 107                     raise ValueError('cannot index with vector containing '
    108                                      'NA / NaN values')
    109                 return False

ValueError: cannot index with vector containing NA / NaN values
However, these can be filled in using fillna() and it will work fine:
In [135]: reindexed[crit.fillna(False)]
Out[135]:
0 0.126504
2 0.696198
4 0.697416
6 0.601516
7 0.003659
dtype: float64
In [136]: reindexed[crit.fillna(True)]
������������������������������������������������������������������������������������������������Out[136]:
0 0.126504
1 0.000000
2 0.696198
3 0.000000
4 0.697416
5 0.000000
6 0.601516
7 0.003659
dtype: float64