pandas.io.formats.style.Styler.highlight_between
- Styler.highlight_between(subset=None, color='yellow', axis=0, left=None, right=None, inclusive='both', props=None)[source]
Highlight a defined range with a style.
New in version 1.3.0.
- Parameters
- subsetlabel, array-like, IndexSlice, optional
A valid 2d input to DataFrame.loc[<subset>], or, in the case of a 1d input or single key, to DataFrame.loc[:, <subset>] where the columns are prioritised, to limit
datato before applying the function.- colorstr, default ‘yellow’
Background color to use for highlighting.
- axis{0 or ‘index’, 1 or ‘columns’, None}, default 0
If
leftorrightgiven as sequence, axis along which to apply those boundaries. See examples.- leftscalar or datetime-like, or sequence or array-like, default None
Left bound for defining the range.
- rightscalar or datetime-like, or sequence or array-like, default None
Right bound for defining the range.
- inclusive{‘both’, ‘neither’, ‘left’, ‘right’}
Identify whether bounds are closed or open.
- propsstr, default None
CSS properties to use for highlighting. If
propsis given,coloris not used.
- Returns
- selfStyler
See also
Styler.highlight_nullHighlight missing values with a style.
Styler.highlight_maxHighlight the maximum with a style.
Styler.highlight_minHighlight the minimum with a style.
Styler.highlight_quantileHighlight values defined by a quantile with a style.
Notes
If
leftisNoneonly the right bound is applied. IfrightisNoneonly the left bound is applied. If both areNoneall values are highlighted.axisis only needed ifleftorrightare provided as a sequence or an array-like object for aligning the shapes. Ifleftandrightare both scalars then allaxisinputs will give the same result.This function only works with compatible
dtypes. For example a datetime-like region can only use equivalent datetime-likeleftandrightarguments. Usesubsetto control regions which have multipledtypes.Examples
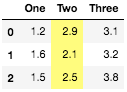
Basic usage
>>> df = pd.DataFrame({
...     'One': [1.2, 1.6, 1.5],
...     'Two': [2.9, 2.1, 2.5],
...     'Three': [3.1, 3.2, 3.8],
... })
>>> df.style.highlight_between(left=2.1, right=2.9)
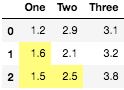
Using a range input sequnce along an
axis, in this case setting aleftandrightfor each column individually>>> df.style.highlight_between(left=[1.4, 2.4, 3.4], right=[1.6, 2.6, 3.6], ... axis=1, color="#fffd75")
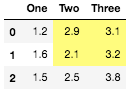
Using
axis=Noneand providing theleftargument as an array that matches the input DataFrame, with a constantright>>> df.style.highlight_between(left=[[2,2,3],[2,2,3],[3,3,3]], right=3.5, ... axis=None, color="#fffd75")
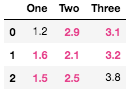
Using
propsinstead of default background coloring>>> df.style.highlight_between(left=1.5, right=3.5, ... props='font-weight:bold;color:#e83e8c')