pandas.io.formats.style.Styler.to_latex¶
- Styler.to_latex(buf=None, *, column_format=None, position=None, position_float=None, hrules=None, clines=None, label=None, caption=None, sparse_index=None, sparse_columns=None, multirow_align=None, multicol_align=None, siunitx=False, environment=None, encoding=None, convert_css=False)[source]¶
Write Styler to a file, buffer or string in LaTeX format.
New in version 1.3.0.
- Parameters
- bufstr, path object, file-like object, or None, default None
String, path object (implementing
os.PathLike[str]), or file-like object implementing a stringwrite()function. If None, the result is returned as a string.- column_formatstr, optional
The LaTeX column specification placed in location:
\begin{tabular}{<column_format>}
Defaults to ‘l’ for index and non-numeric data columns, and, for numeric data columns, to ‘r’ by default, or ‘S’ if
siunitxisTrue.- positionstr, optional
The LaTeX positional argument (e.g. ‘h!’) for tables, placed in location:
\\begin{table}[<position>].- position_float{“centering”, “raggedleft”, “raggedright”}, optional
The LaTeX float command placed in location:
\begin{table}[<position>]
\<position_float>
Cannot be used if
environmentis “longtable”.- hrulesbool
Set to True to add \toprule, \midrule and \bottomrule from the {booktabs} LaTeX package. Defaults to
pandas.options.styler.latex.hrules, which is False.Changed in version 1.4.0.
- clinesstr, optional
Use to control adding \cline commands for the index labels separation. Possible values are:
None: no cline commands are added (default).
“all;data”: a cline is added for every index value extending the width of the table, including data entries.
“all;index”: as above with lines extending only the width of the index entries.
“skip-last;data”: a cline is added for each index value except the last level (which is never sparsified), extending the widtn of the table.
“skip-last;index”: as above with lines extending only the width of the index entries.
New in version 1.4.0.
- labelstr, optional
The LaTeX label included as: \label{<label>}. This is used with \ref{<label>} in the main .tex file.
- captionstr, tuple, optional
If string, the LaTeX table caption included as: \caption{<caption>}. If tuple, i.e (“full caption”, “short caption”), the caption included as: \caption[<caption[1]>]{<caption[0]>}.
- sparse_indexbool, optional
Whether to sparsify the display of a hierarchical index. Setting to False will display each explicit level element in a hierarchical key for each row. Defaults to
pandas.options.styler.sparse.index, which is True.- sparse_columnsbool, optional
Whether to sparsify the display of a hierarchical index. Setting to False will display each explicit level element in a hierarchical key for each column. Defaults to
pandas.options.styler.sparse.columns, which is True.- multirow_align{“c”, “t”, “b”, “naive”}, optional
If sparsifying hierarchical MultiIndexes whether to align text centrally, at the top or bottom using the multirow package. If not given defaults to
pandas.options.styler.latex.multirow_align, which is “c”. If “naive” is given renders without multirow.Changed in version 1.4.0.
- multicol_align{“r”, “c”, “l”, “naive-l”, “naive-r”}, optional
If sparsifying hierarchical MultiIndex columns whether to align text at the left, centrally, or at the right. If not given defaults to
pandas.options.styler.latex.multicol_align, which is “r”. If a naive option is given renders without multicol. Pipe decorators can also be added to non-naive values to draw vertical rules, e.g. “|r” will draw a rule on the left side of right aligned merged cells.Changed in version 1.4.0.
- siunitxbool, default False
Set to
Trueto structure LaTeX compatible with the {siunitx} package.- environmentstr, optional
If given, the environment that will replace ‘table’ in
\\begin{table}. If ‘longtable’ is specified then a more suitable template is rendered. If not given defaults topandas.options.styler.latex.environment, which is None.New in version 1.4.0.
- encodingstr, optional
Character encoding setting. Defaults to
pandas.options.styler.render.encoding, which is “utf-8”.- convert_cssbool, default False
Convert simple cell-styles from CSS to LaTeX format. Any CSS not found in conversion table is dropped. A style can be forced by adding option –latex. See notes.
- Returns
- str or None
If buf is None, returns the result as a string. Otherwise returns None.
See also
Styler.formatFormat the text display value of cells.
Notes
Latex Packages
For the following features we recommend the following LaTeX inclusions:
Feature
Inclusion
sparse columns
none: included within default {tabular} environment
sparse rows
\usepackage{multirow}
hrules
\usepackage{booktabs}
colors
\usepackage[table]{xcolor}
siunitx
\usepackage{siunitx}
bold (with siunitx)
\usepackage{etoolbox}\robustify\bfseries\sisetup{detect-all = true} (within {document})italic (with siunitx)
\usepackage{etoolbox}\robustify\itshape\sisetup{detect-all = true} (within {document})environment
\usepackage{longtable} if arg is “longtable” | or any other relevant environment package
hyperlinks
\usepackage{hyperref}
Cell Styles
LaTeX styling can only be rendered if the accompanying styling functions have been constructed with appropriate LaTeX commands. All styling functionality is built around the concept of a CSS
(<attribute>, <value>)pair (see Table Visualization), and this should be replaced by a LaTeX(<command>, <options>)approach. Each cell will be styled individually using nested LaTeX commands with their accompanied options.For example the following code will highlight and bold a cell in HTML-CSS:
>>> df = pd.DataFrame([[1,2], [3,4]])
>>> s = df.style.highlight_max(axis=None,
...                            props='background-color:red; font-weight:bold;')
>>> s.to_html()
The equivalent using LaTeX only commands is the following:
>>> s = df.style.highlight_max(axis=None,
...                            props='cellcolor:{red}; bfseries: ;')
>>> s.to_latex()
Internally these structured LaTeX
(<command>, <options>)pairs are translated to thedisplay_valuewith the default structure:\<command><options> <display_value>. Where there are multiple commands the latter is nested recursively, so that the above example highlighed cell is rendered as\cellcolor{red} \bfseries 4.Occasionally this format does not suit the applied command, or combination of LaTeX packages that is in use, so additional flags can be added to the
<options>, within the tuple, to result in different positions of required braces (the default being the same as--nowrap):Tuple Format
Output Structure
(<command>,<options>)
\<command><options> <display_value>
(<command>,<options>
--nowrap)\<command><options> <display_value>
(<command>,<options>
--rwrap)\<command><options>{<display_value>}
(<command>,<options>
--wrap){\<command><options> <display_value>}
(<command>,<options>
--lwrap){\<command><options>} <display_value>
(<command>,<options>
--dwrap){\<command><options>}{<display_value>}
For example the textbf command for font-weight should always be used with –rwrap so
('textbf', '--rwrap')will render a working cell, wrapped with braces, as\textbf{<display_value>}.A more comprehensive example is as follows:
>>> df = pd.DataFrame([[1, 2.2, "dogs"], [3, 4.4, "cats"], [2, 6.6, "cows"]],
...                   index=["ix1", "ix2", "ix3"],
...                   columns=["Integers", "Floats", "Strings"])
>>> s = df.style.highlight_max(
...     props='cellcolor:[HTML]{FFFF00}; color:{red};'
...           'textit:--rwrap; textbf:--rwrap;'
... )
>>> s.to_latex()
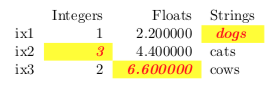
Table Styles
Internally Styler uses its
table_stylesobject to parse thecolumn_format,position,position_float, andlabelinput arguments. These arguments are added to table styles in the format:set_table_styles([ {"selector": "column_format", "props": f":{column_format};"}, {"selector": "position", "props": f":{position};"}, {"selector": "position_float", "props": f":{position_float};"}, {"selector": "label", "props": f":{{{label.replace(':','§')}}};"} ], overwrite=False)
Exception is made for the
hrulesargument which, in fact, controls all three commands:toprule,bottomruleandmidrulesimultaneously. Instead of settinghrulestoTrue, it is also possible to set each individual rule definition, by manually setting thetable_styles, for example below we set a regulartoprule, set anhlineforbottomruleand exclude themidrule:set_table_styles([ {'selector': 'toprule', 'props': ':toprule;'}, {'selector': 'bottomrule', 'props': ':hline;'}, ], overwrite=False)
If other
commandsare added to table styles they will be detected, and positioned immediately above the ‘\begin{tabular}’ command. For example to add odd and even row coloring, from the {colortbl} package, in format\rowcolors{1}{pink}{red}, use:set_table_styles([ {'selector': 'rowcolors', 'props': ':{1}{pink}{red};'} ], overwrite=False)
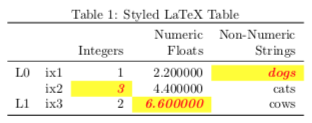
A more comprehensive example using these arguments is as follows:
>>> df.columns = pd.MultiIndex.from_tuples([
...     ("Numeric", "Integers"),
...     ("Numeric", "Floats"),
...     ("Non-Numeric", "Strings")
... ])
>>> df.index = pd.MultiIndex.from_tuples([
...     ("L0", "ix1"), ("L0", "ix2"), ("L1", "ix3")
... ])
>>> s = df.style.highlight_max(
...     props='cellcolor:[HTML]{FFFF00}; color:{red}; itshape:; bfseries:;'
... )
>>> s.to_latex(
...     column_format="rrrrr", position="h", position_float="centering",
...     hrules=True, label="table:5", caption="Styled LaTeX Table",
...     multirow_align="t", multicol_align="r"
... )
Formatting
To format values
Styler.format()should be used prior to calling Styler.to_latex, as well as other methods such asStyler.hide()for example:>>> s.clear() >>> s.table_styles = [] >>> s.caption = None >>> s.format({ ... ("Numeric", "Integers"): '\${}', ... ("Numeric", "Floats"): '{:.3f}', ... ("Non-Numeric", "Strings"): str.upper ... }) Numeric Non-Numeric Integers Floats Strings L0 ix1 $1 2.200 DOGS ix2 $3 4.400 CATS L1 ix3 $2 6.600 COWS
>>> s.to_latex()
\begin{tabular}{llrrl}
{} & {} & \multicolumn{2}{r}{Numeric} & {Non-Numeric} \\
{} & {} & {Integers} & {Floats} & {Strings} \\
\multirow[c]{2}{*}{L0} & ix1 & \\$1 & 2.200 & DOGS \\
 & ix2 & \$3 & 4.400 & CATS \\
L1 & ix3 & \$2 & 6.600 & COWS \\
\end{tabular}
CSS Conversion
This method can convert a Styler constructured with HTML-CSS to LaTeX using the following limited conversions.
CSS Attribute
CSS value
LaTeX Command
LaTeX Options
font-weight
boldbolderbfseriesbfseriesfont-style
italicobliqueitshapeslshapebackground-color
red#fe01ea#f0ergb(128,255,0)rgba(128,0,0,0.5)rgb(25%,255,50%)cellcolor
{red}–lwrap[HTML]{FE01EA}–lwrap[HTML]{FF00EE}–lwrap[rgb]{0.5,1,0}–lwrap[rgb]{0.5,0,0}–lwrap[rgb]{0.25,1,0.5}–lwrapcolor
red#fe01ea#f0ergb(128,255,0)rgba(128,0,0,0.5)rgb(25%,255,50%)color
{red}[HTML]{FE01EA}[HTML]{FF00EE}[rgb]{0.5,1,0}[rgb]{0.5,0,0}[rgb]{0.25,1,0.5}It is also possible to add user-defined LaTeX only styles to a HTML-CSS Styler using the
--latexflag, and to add LaTeX parsing options that the converter will detect within a CSS-comment.>>> df = pd.DataFrame([[1]]) >>> df.style.set_properties( ... **{"font-weight": "bold /* --dwrap */", "Huge": "--latex--rwrap"} ... ).to_latex(convert_css=True) \begin{tabular}{lr} {} & {0} \\ 0 & {\bfseries}{\Huge{1}} \\ \end{tabular}
Examples
Below we give a complete step by step example adding some advanced features and noting some common gotchas.
First we create the DataFrame and Styler as usual, including MultiIndex rows and columns, which allow for more advanced formatting options:
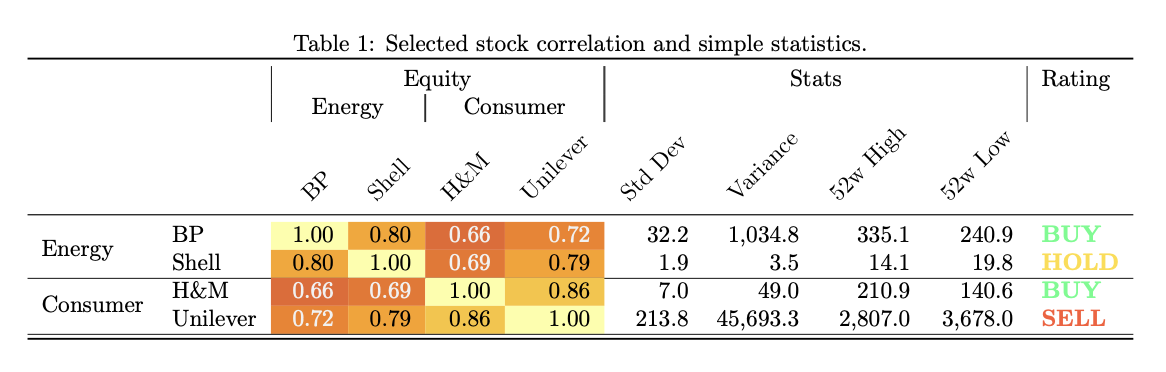
>>> cidx = pd.MultiIndex.from_arrays([
...     ["Equity", "Equity", "Equity", "Equity",
...      "Stats", "Stats", "Stats", "Stats", "Rating"],
...     ["Energy", "Energy", "Consumer", "Consumer", "", "", "", "", ""],
...     ["BP", "Shell", "H&M", "Unilever",
...      "Std Dev", "Variance", "52w High", "52w Low", ""]
... ])
>>> iidx = pd.MultiIndex.from_arrays([
...     ["Equity", "Equity", "Equity", "Equity"],
...     ["Energy", "Energy", "Consumer", "Consumer"],
...     ["BP", "Shell", "H&M", "Unilever"]
... ])
>>> styler = pd.DataFrame([
...     [1, 0.8, 0.66, 0.72, 32.1678, 32.1678**2, 335.12, 240.89, "Buy"],
...     [0.8, 1.0, 0.69, 0.79, 1.876, 1.876**2, 14.12, 19.78, "Hold"],
...     [0.66, 0.69, 1.0, 0.86, 7, 7**2, 210.9, 140.6, "Buy"],
...     [0.72, 0.79, 0.86, 1.0, 213.76, 213.76**2, 2807, 3678, "Sell"],
... ], columns=cidx, index=iidx).style
Second we will format the display and, since our table is quite wide, will hide the repeated level-0 of the index:
>>> styler.format(subset="Equity", precision=2)
...       .format(subset="Stats", precision=1, thousands=",")
...       .format(subset="Rating", formatter=str.upper)
...       .format_index(escape="latex", axis=1)
...       .format_index(escape="latex", axis=0)
...       .hide(level=0, axis=0)
Note that one of the string entries of the index and column headers is “H&M”. Without applying the escape=”latex” option to the format_index method the resultant LaTeX will fail to render, and the error returned is quite difficult to debug. Using the appropriate escape the “&” is converted to “\&”.
Thirdly we will apply some (CSS-HTML) styles to our object. We will use a builtin method and also define our own method to highlight the stock recommendation:
>>> def rating_color(v):
...     if v == "Buy": color = "#33ff85"
...     elif v == "Sell": color = "#ff5933"
...     else: color = "#ffdd33"
...     return f"color: {color}; font-weight: bold;"
>>> styler.background_gradient(cmap="inferno", subset="Equity", vmin=0, vmax=1)
...       .applymap(rating_color, subset="Rating")
All the above styles will work with HTML (see below) and LaTeX upon conversion:
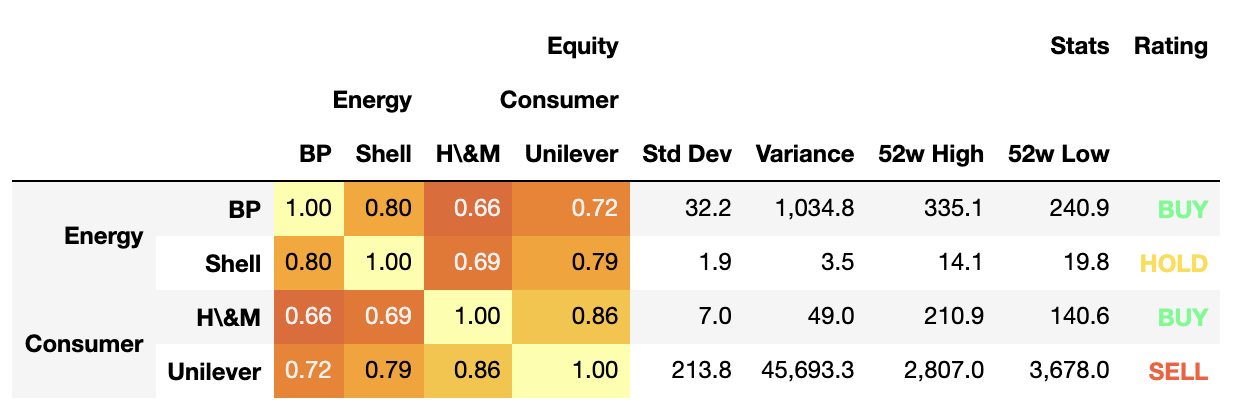
However, we finally want to add one LaTeX only style (from the {graphicx} package), that is not easy to convert from CSS and pandas does not support it. Notice the –latex flag used here, as well as –rwrap to ensure this is formatted correctly and not ignored upon conversion.
>>> styler.applymap_index(
...     lambda v: "rotatebox:{45}--rwrap--latex;", level=2, axis=1
... )
Finally we render our LaTeX adding in other options as required:
>>> styler.to_latex(
...     caption="Selected stock correlation and simple statistics.",
...     clines="skip-last;data",
...     convert_css=True,
...     position_float="centering",
...     multicol_align="|c|",
...     hrules=True,
... )
\begin{table}
\centering
\caption{Selected stock correlation and simple statistics.}
\begin{tabular}{llrrrrrrrrl}
\toprule
 &  & \multicolumn{4}{|c|}{Equity} & \multicolumn{4}{|c|}{Stats} & Rating \\
 &  & \multicolumn{2}{|c|}{Energy} & \multicolumn{2}{|c|}{Consumer} &
\multicolumn{4}{|c|}{} &  \\
 &  & \rotatebox{45}{BP} & \rotatebox{45}{Shell} & \rotatebox{45}{H\&M} &
\rotatebox{45}{Unilever} & \rotatebox{45}{Std Dev} & \rotatebox{45}{Variance} &
\rotatebox{45}{52w High} & \rotatebox{45}{52w Low} & \rotatebox{45}{} \\
\midrule
\multirow[c]{2}{*}{Energy} & BP & {\cellcolor[HTML]{FCFFA4}}
\color[HTML]{000000} 1.00 & {\cellcolor[HTML]{FCA50A}} \color[HTML]{000000}
0.80 & {\cellcolor[HTML]{EB6628}} \color[HTML]{F1F1F1} 0.66 &
{\cellcolor[HTML]{F68013}} \color[HTML]{F1F1F1} 0.72 & 32.2 & 1,034.8 & 335.1
& 240.9 & \color[HTML]{33FF85} \bfseries BUY \\
 & Shell & {\cellcolor[HTML]{FCA50A}} \color[HTML]{000000} 0.80 &
{\cellcolor[HTML]{FCFFA4}} \color[HTML]{000000} 1.00 &
{\cellcolor[HTML]{F1731D}} \color[HTML]{F1F1F1} 0.69 &
{\cellcolor[HTML]{FCA108}} \color[HTML]{000000} 0.79 & 1.9 & 3.5 & 14.1 &
19.8 & \color[HTML]{FFDD33} \bfseries HOLD \\
\cline{1-11}
\multirow[c]{2}{*}{Consumer} & H\&M & {\cellcolor[HTML]{EB6628}}
\color[HTML]{F1F1F1} 0.66 & {\cellcolor[HTML]{F1731D}} \color[HTML]{F1F1F1}
0.69 & {\cellcolor[HTML]{FCFFA4}} \color[HTML]{000000} 1.00 &
{\cellcolor[HTML]{FAC42A}} \color[HTML]{000000} 0.86 & 7.0 & 49.0 & 210.9 &
140.6 & \color[HTML]{33FF85} \bfseries BUY \\
 & Unilever & {\cellcolor[HTML]{F68013}} \color[HTML]{F1F1F1} 0.72 &
{\cellcolor[HTML]{FCA108}} \color[HTML]{000000} 0.79 &
{\cellcolor[HTML]{FAC42A}} \color[HTML]{000000} 0.86 &
{\cellcolor[HTML]{FCFFA4}} \color[HTML]{000000} 1.00 & 213.8 & 45,693.3 &
2,807.0 & 3,678.0 & \color[HTML]{FF5933} \bfseries SELL \\
\cline{1-11}
\bottomrule
\end{tabular}
\end{table}