pandas.api.typing.DataFrameGroupBy.hist#
- DataFrameGroupBy.hist(column=None, by=None, grid=True, xlabelsize=None, xrot=None, ylabelsize=None, yrot=None, ax=None, sharex=False, sharey=False, figsize=None, layout=None, bins=10, backend=None, legend=False, **kwargs)[source]#
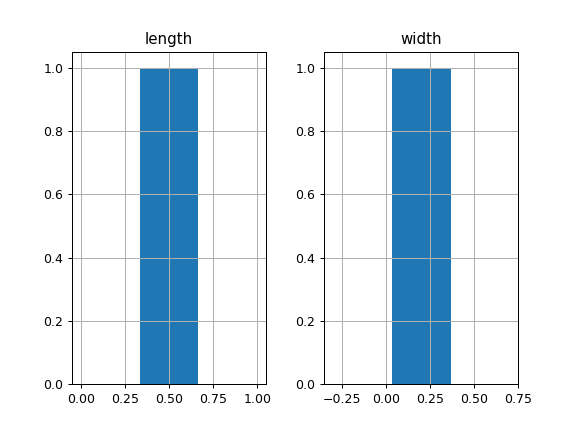
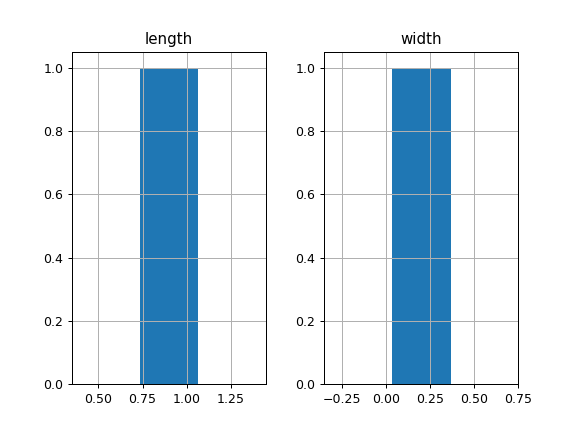
Draw histogram of the DataFrame’s columns for each group.
A separate histogram subplot is generated for each group, making it easier to visually compare the distribution of each numeric column across groups. Internally this calls
DataFrame.hist()on every group’s frame, so the same matplotlib options are accepted.- Parameters:
- columnstr or sequence, optional
If passed, will be used to limit data to a subset of columns.
- byobject, optional
If passed, then used to form histograms for separate groups.
- gridbool, default True
Whether to show axis grid lines.
- xlabelsizeint, default None
If specified changes the x-axis label size.
- xrotfloat, default None
Rotation of x axis labels. For example, a value of 90 displays the x labels rotated 90 degrees clockwise.
- ylabelsizeint, default None
If specified changes the y-axis label size.
- yrotfloat, default None
Rotation of y axis labels. For example, a value of 90 displays the y labels rotated 90 degrees clockwise.
- axMatplotlib axes object, default None
The axes to plot the histogram on.
- sharexbool, default True if ax is None else False
In case subplots=True, share x axis and set some x axis labels to invisible; defaults to True if ax is None otherwise False if an ax is passed in. Note that passing in both an ax and sharex=True will alter all x axis labels for all subplots in a figure.
- shareybool, default False
In case subplots=True, share y axis and set some y axis labels to invisible.
- figsizetuple, optional
The size in inches of the figure to create. Uses the value in matplotlib.rcParams by default.
- layouttuple, optional
Tuple of (rows, columns) for the layout of the histograms.
- binsint or sequence, default 10
Number of histogram bins to be used. If an integer is given, bins + 1 bin edges are calculated and returned. If bins is a sequence, gives bin edges, including left edge of first bin and right edge of last bin. In this case, bins is returned unmodified.
- backendstr, default None
Backend to use instead of the backend specified in the option
plotting.backend. For instance, ‘matplotlib’. Alternatively, to specify theplotting.backendfor the whole session, setpd.options.plotting.backend.- legendbool, default False
Whether to show the legend.
- **kwargs
All other plotting keyword arguments to be passed to
matplotlib.pyplot.hist().
- Returns:
- matplotlib.Axes or numpy.ndarray
A
matplotlib.Axesobject or an array ofAxesobjects, depending on the layout and grouping.
See also
DataFrame.histEquivalent histogram plotting method on DataFrame.
matplotlib.pyplot.histPlot a histogram using matplotlib.
Examples
For each animal category, draw a histogram of the numeric columns. The grouping column is used to split the data; one set of histogram subplots is produced per group.
>>> df = pd.DataFrame(
...     {
...         "animal": ["cat", "cat", "dog", "dog", "dog"],
...         "length": [1.0, 1.2, 1.5, 1.7, 2.0],
...         "weight": [4.5, 5.0, 10.0, 12.5, 15.0],
...     }
... )
>>> hist = df.groupby("animal").hist(bins=3)