
pandas.DataFrame.plot.hist#
- DataFrame.plot.hist(by=None, bins=10, **kwargs)[source]#
Make one histogram of the DataFrame’s columns.
A histogram is a representation of the distribution of data. This function groups the values of all given Series in the DataFrame into bins and draws all bins in one
matplotlib.axes.Axes. This is useful when the DataFrame’s Series are in a similar scale.- Parameters:
- bystr or sequence, optional
Column in the DataFrame to group by.
- binsint, default 10
Number of histogram bins to be used.
- **kwargs
Additional keyword arguments, such as
ax,figsize,titleandlegend, are documented inDataFrame.plot().
- Returns:
- matplotlib.axes.Axes or numpy.ndarray of them
An ndarray of
matplotlib.axes.Axesis returned whensubplots=Trueorbyis given.
See also
DataFrame.plotMake plots of a DataFrame.
DataFrame.histDraw histograms per DataFrame’s Series.
Series.histDraw a histogram with Series’ data.
Examples
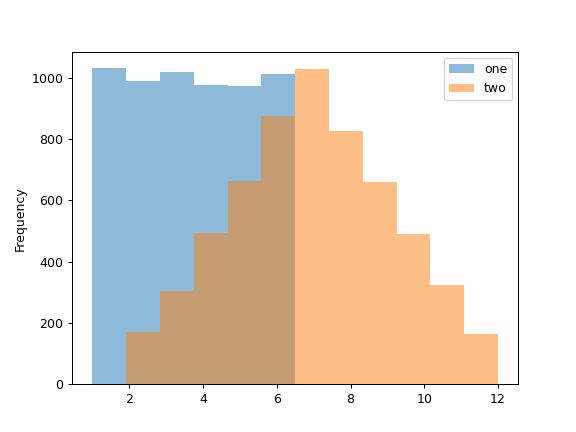
When we roll a die 6000 times, we expect to get each value around 1000 times. But when we roll two dice and sum the result, the distribution is going to be quite different. A histogram illustrates those distributions.
>>> rng = np.random.default_rng(42)
>>> df = pd.DataFrame(rng.integers(1, 7, 6000), columns=["one"])
>>> df["two"] = df["one"] + rng.integers(1, 7, 6000)
>>> ax = df.plot.hist(bins=12, alpha=0.5)
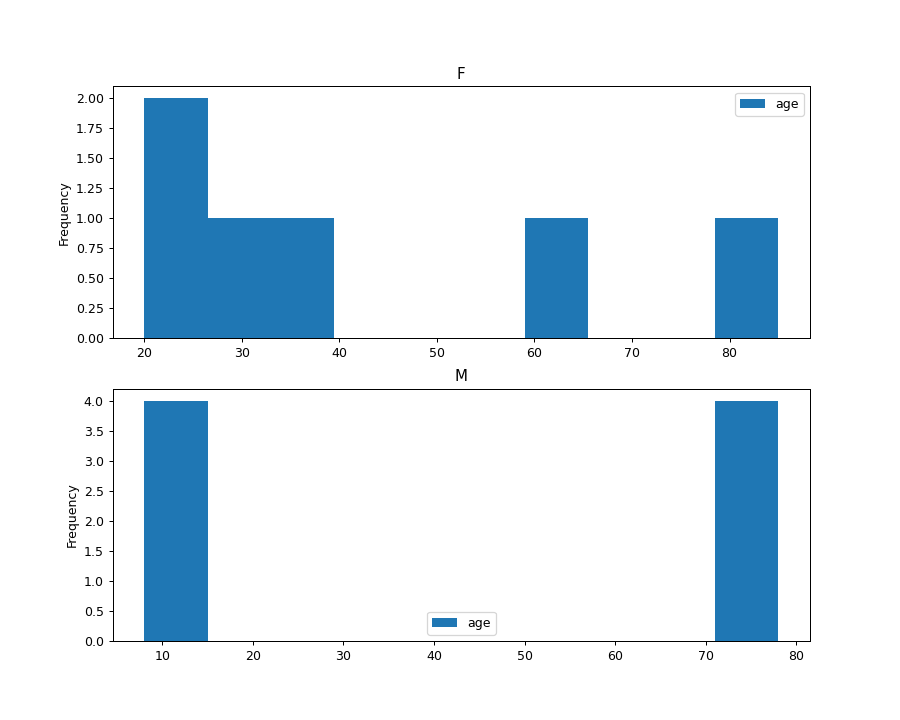
A grouped histogram can be generated by providing the parameter by (which can be a column name, or a list of column names):
>>> age_list = [8, 10, 12, 14, 72, 74, 76, 78, 20, 25, 30, 35, 60, 85]
>>> df = pd.DataFrame({"gender": list("MMMMMMMMFFFFFF"), "age": age_list})
>>> ax = df.plot.hist(column=["age"], by="gender", figsize=(10, 8))