pandas.core.groupby.DataFrameGroupBy.boxplot#
- DataFrameGroupBy.boxplot(subplots=True, column=None, fontsize=None, rot=0, grid=True, ax=None, figsize=None, layout=None, sharex=False, sharey=True, backend=None, **kwargs)[source]#
Make box plots from DataFrameGroupBy data.
- Parameters:
- groupedGrouped DataFrame
- subplotsbool
False- no subplots will be usedTrue- create a subplot for each group.
- columncolumn name or list of names, or vector
Can be any valid input to groupby.
- fontsizefloat or str
- rotlabel rotation angle
- gridSetting this to True will show the grid
- axMatplotlib axis object, default None
- figsizeA tuple (width, height) in inches
- layouttuple (optional)
The layout of the plot: (rows, columns).
- sharexbool, default False
Whether x-axes will be shared among subplots.
- shareybool, default True
Whether y-axes will be shared among subplots.
- backendstr, default None
Backend to use instead of the backend specified in the option
plotting.backend. For instance, ‘matplotlib’. Alternatively, to specify theplotting.backendfor the whole session, setpd.options.plotting.backend.- **kwargs
All other plotting keyword arguments to be passed to matplotlib’s boxplot function.
- Returns:
- dict of key/value = group key/DataFrame.boxplot return value
- or DataFrame.boxplot return value in case subplots=figures=False
Examples
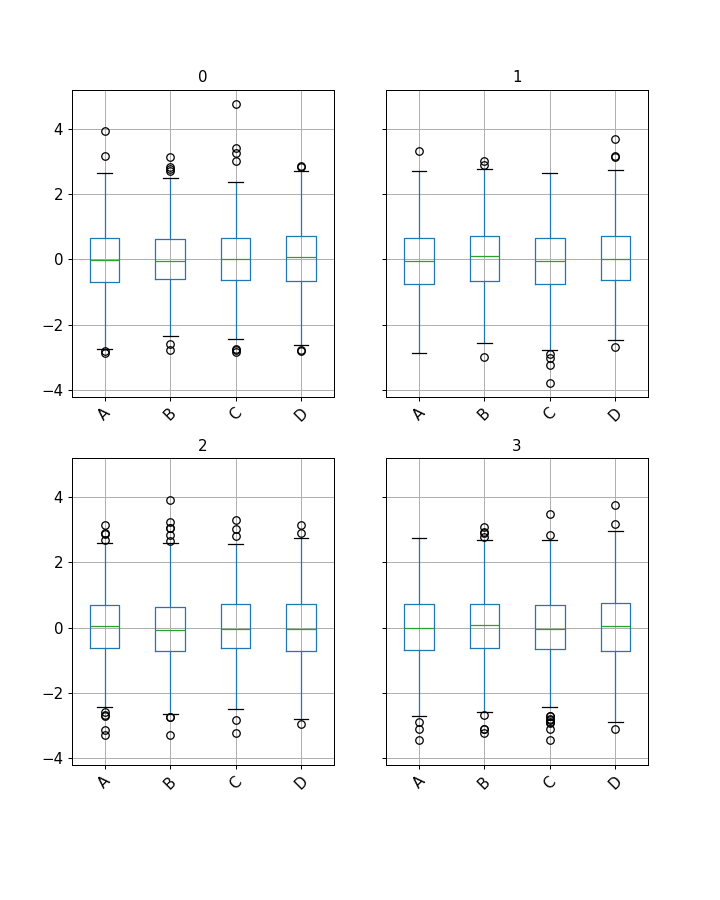
You can create boxplots for grouped data and show them as separate subplots:
>>> import itertools
>>> tuples = [t for t in itertools.product(range(1000), range(4))]
>>> index = pd.MultiIndex.from_tuples(tuples, names=['lvl0', 'lvl1'])
>>> data = np.random.randn(len(index), 4)
>>> df = pd.DataFrame(data, columns=list('ABCD'), index=index)
>>> grouped = df.groupby(level='lvl1')
>>> grouped.boxplot(rot=45, fontsize=12, figsize=(8, 10))
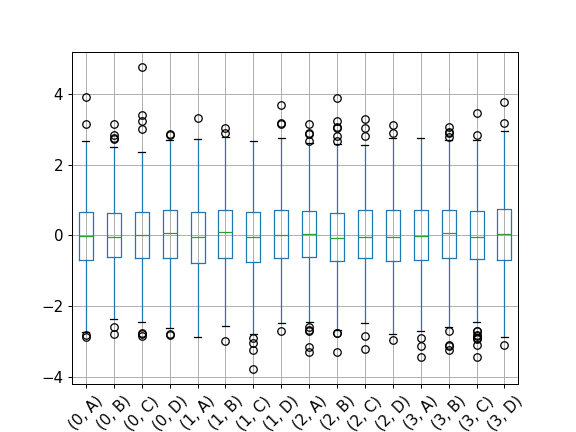
The
subplots=Falseoption shows the boxplots in a single figure.>>> grouped.boxplot(subplots=False, rot=45, fontsize=12)