pandas.core.groupby.SeriesGroupBy.hist#
- SeriesGroupBy.hist(by=None, ax=None, grid=True, xlabelsize=None, xrot=None, ylabelsize=None, yrot=None, figsize=None, bins=10, backend=None, legend=False, **kwargs)[source]#
Draw histogram of the input series using matplotlib.
- Parameters:
- byobject, optional
If passed, then used to form histograms for separate groups.
- axmatplotlib axis object
If not passed, uses gca().
- gridbool, default True
Whether to show axis grid lines.
- xlabelsizeint, default None
If specified changes the x-axis label size.
- xrotfloat, default None
Rotation of x axis labels.
- ylabelsizeint, default None
If specified changes the y-axis label size.
- yrotfloat, default None
Rotation of y axis labels.
- figsizetuple, default None
Figure size in inches by default.
- binsint or sequence, default 10
Number of histogram bins to be used. If an integer is given, bins + 1 bin edges are calculated and returned. If bins is a sequence, gives bin edges, including left edge of first bin and right edge of last bin. In this case, bins is returned unmodified.
- backendstr, default None
Backend to use instead of the backend specified in the option
plotting.backend. For instance, ‘matplotlib’. Alternatively, to specify theplotting.backendfor the whole session, setpd.options.plotting.backend.- legendbool, default False
Whether to show the legend.
- **kwargs
To be passed to the actual plotting function.
- Returns:
- matplotlib.AxesSubplot
A histogram plot.
See also
matplotlib.axes.Axes.histPlot a histogram using matplotlib.
Examples
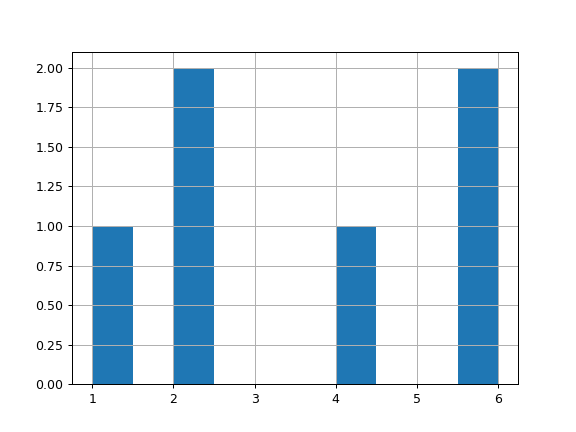
For Series:
>>> lst = ['a', 'a', 'a', 'b', 'b', 'b']
>>> ser = pd.Series([1, 2, 2, 4, 6, 6], index=lst)
>>> hist = ser.hist()
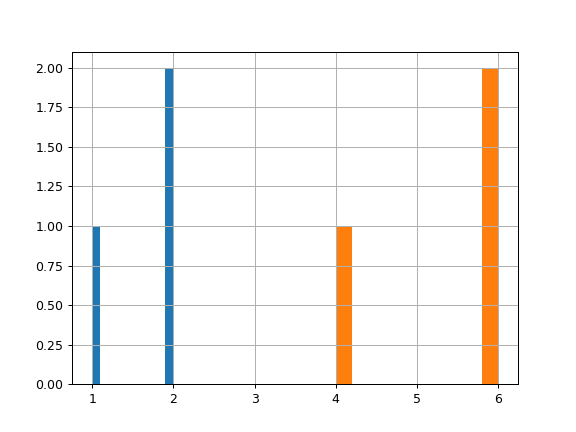
For Groupby:
>>> lst = ['a', 'a', 'a', 'b', 'b', 'b']
>>> ser = pd.Series([1, 2, 2, 4, 6, 6], index=lst)
>>> hist = ser.groupby(level=0).hist()