pandas.core.groupby.SeriesGroupBy.plot#
- property SeriesGroupBy.plot[source]#
Make plots of Series or DataFrame.
Uses the backend specified by the option
plotting.backend. By default, matplotlib is used.- Parameters:
- dataSeries or DataFrame
The object for which the method is called.
- xlabel or position, default None
Only used if data is a DataFrame.
- ylabel, position or list of label, positions, default None
Allows plotting of one column versus another. Only used if data is a DataFrame.
- kindstr
The kind of plot to produce:
‘line’ : line plot (default)
‘bar’ : vertical bar plot
‘barh’ : horizontal bar plot
‘hist’ : histogram
‘box’ : boxplot
‘kde’ : Kernel Density Estimation plot
‘density’ : same as ‘kde’
‘area’ : area plot
‘pie’ : pie plot
‘scatter’ : scatter plot (DataFrame only)
‘hexbin’ : hexbin plot (DataFrame only)
- axmatplotlib axes object, default None
An axes of the current figure.
- subplotsbool or sequence of iterables, default False
Whether to group columns into subplots:
False: No subplots will be usedTrue: Make separate subplots for each column.sequence of iterables of column labels: Create a subplot for each group of columns. For example [(‘a’, ‘c’), (‘b’, ‘d’)] will create 2 subplots: one with columns ‘a’ and ‘c’, and one with columns ‘b’ and ‘d’. Remaining columns that aren’t specified will be plotted in additional subplots (one per column).
Added in version 1.5.0.
- sharexbool, default True if ax is None else False
In case
subplots=True, share x axis and set some x axis labels to invisible; defaults to True if ax is None otherwise False if an ax is passed in; Be aware, that passing in both an ax andsharex=Truewill alter all x axis labels for all axis in a figure.- shareybool, default False
In case
subplots=True, share y axis and set some y axis labels to invisible.- layouttuple, optional
(rows, columns) for the layout of subplots.
- figsizea tuple (width, height) in inches
Size of a figure object.
- use_indexbool, default True
Use index as ticks for x axis.
- titlestr or list
Title to use for the plot. If a string is passed, print the string at the top of the figure. If a list is passed and subplots is True, print each item in the list above the corresponding subplot.
- gridbool, default None (matlab style default)
Axis grid lines.
- legendbool or {‘reverse’}
Place legend on axis subplots.
- stylelist or dict
The matplotlib line style per column.
- logxbool or ‘sym’, default False
Use log scaling or symlog scaling on x axis.
- logybool or ‘sym’ default False
Use log scaling or symlog scaling on y axis.
- loglogbool or ‘sym’, default False
Use log scaling or symlog scaling on both x and y axes.
- xtickssequence
Values to use for the xticks.
- ytickssequence
Values to use for the yticks.
- xlim2-tuple/list
Set the x limits of the current axes.
- ylim2-tuple/list
Set the y limits of the current axes.
- xlabellabel, optional
Name to use for the xlabel on x-axis. Default uses index name as xlabel, or the x-column name for planar plots.
Changed in version 2.0.0: Now applicable to histograms.
- ylabellabel, optional
Name to use for the ylabel on y-axis. Default will show no ylabel, or the y-column name for planar plots.
Changed in version 2.0.0: Now applicable to histograms.
- rotfloat, default None
Rotation for ticks (xticks for vertical, yticks for horizontal plots).
- fontsizefloat, default None
Font size for xticks and yticks.
- colormapstr or matplotlib colormap object, default None
Colormap to select colors from. If string, load colormap with that name from matplotlib.
- colorbarbool, optional
If True, plot colorbar (only relevant for ‘scatter’ and ‘hexbin’ plots).
- positionfloat
Specify relative alignments for bar plot layout. From 0 (left/bottom-end) to 1 (right/top-end). Default is 0.5 (center).
- tablebool, Series or DataFrame, default False
If True, draw a table using the data in the DataFrame and the data will be transposed to meet matplotlib’s default layout. If a Series or DataFrame is passed, use passed data to draw a table.
- yerrDataFrame, Series, array-like, dict and str
See Plotting with Error Bars for detail.
- xerrDataFrame, Series, array-like, dict and str
Equivalent to yerr.
- stackedbool, default False in line and bar plots, and True in area plot
If True, create stacked plot.
- secondary_ybool or sequence, default False
Whether to plot on the secondary y-axis if a list/tuple, which columns to plot on secondary y-axis.
- mark_rightbool, default True
When using a secondary_y axis, automatically mark the column labels with “(right)” in the legend.
- include_boolbool, default is False
If True, boolean values can be plotted.
- backendstr, default None
Backend to use instead of the backend specified in the option
plotting.backend. For instance, ‘matplotlib’. Alternatively, to specify theplotting.backendfor the whole session, setpd.options.plotting.backend.- **kwargs
Options to pass to matplotlib plotting method.
- Returns:
matplotlib.axes.Axesor numpy.ndarray of themIf the backend is not the default matplotlib one, the return value will be the object returned by the backend.
Notes
See matplotlib documentation online for more on this subject
If kind = ‘bar’ or ‘barh’, you can specify relative alignments for bar plot layout by position keyword. From 0 (left/bottom-end) to 1 (right/top-end). Default is 0.5 (center)
Examples
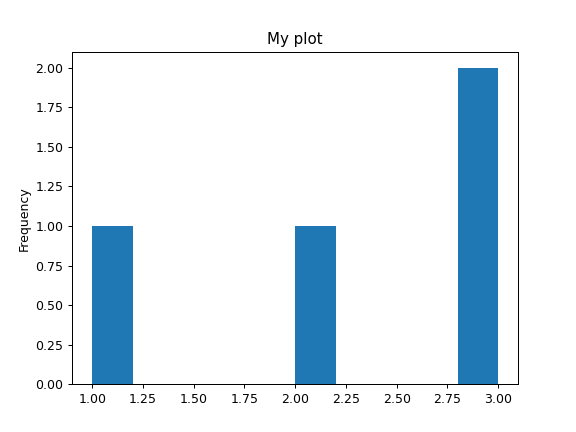
For Series:
>>> ser = pd.Series([1, 2, 3, 3])
>>> plot = ser.plot(kind='hist', title="My plot")
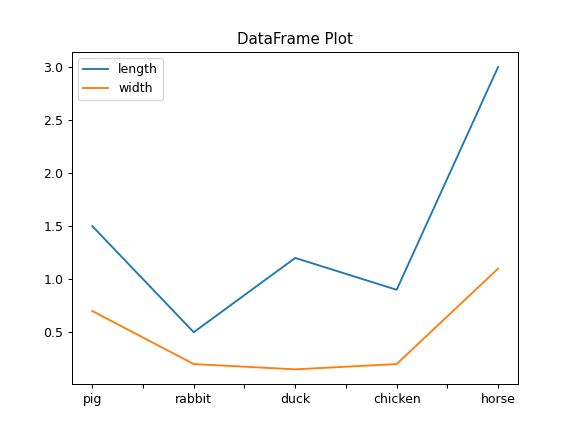
For DataFrame:
>>> df = pd.DataFrame({'length': [1.5, 0.5, 1.2, 0.9, 3],
...                   'width': [0.7, 0.2, 0.15, 0.2, 1.1]},
...                   index=['pig', 'rabbit', 'duck', 'chicken', 'horse'])
>>> plot = df.plot(title="DataFrame Plot")
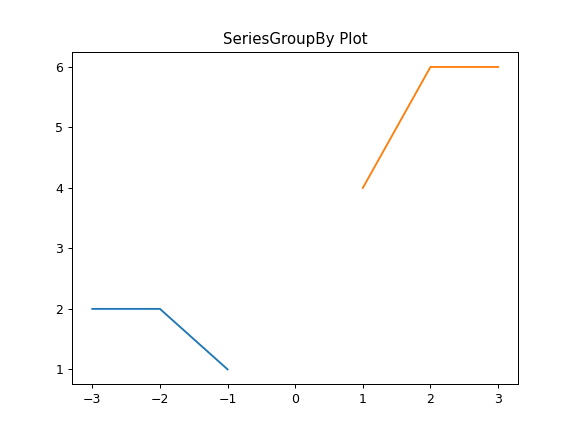
For SeriesGroupBy:
>>> lst = [-1, -2, -3, 1, 2, 3]
>>> ser = pd.Series([1, 2, 2, 4, 6, 6], index=lst)
>>> plot = ser.groupby(lambda x: x > 0).plot(title="SeriesGroupBy Plot")
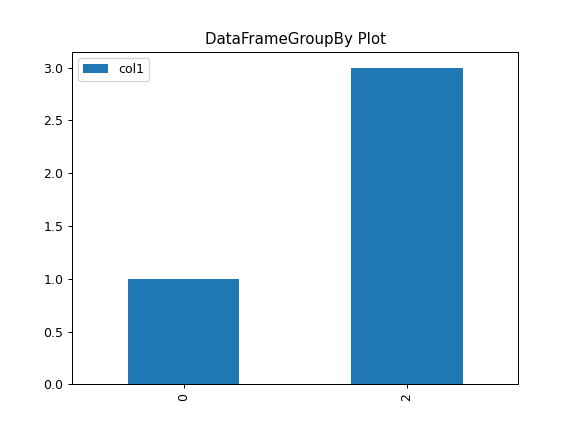
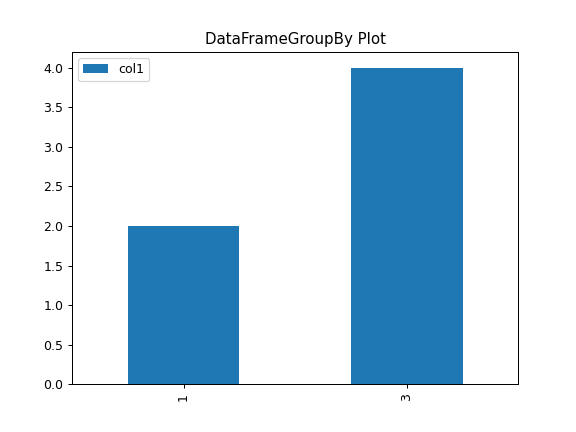
For DataFrameGroupBy:
>>> df = pd.DataFrame({"col1" : [1, 2, 3, 4],
...                   "col2" : ["A", "B", "A", "B"]})
>>> plot = df.groupby("col2").plot(kind="bar", title="DataFrameGroupBy Plot")