pandas.DataFrame.plot.area#
- DataFrame.plot.area(x=None, y=None, stacked=True, **kwargs)[source]#
Draw a stacked area plot.
An area plot displays quantitative data visually. This function wraps the matplotlib area function.
- Parameters:
- xlabel or position, optional
Coordinates for the X axis. By default uses the index.
- ylabel or position, optional
Column to plot. By default uses all columns.
- stackedbool, default True
Area plots are stacked by default. Set to False to create a unstacked plot.
- **kwargs
Additional keyword arguments are documented in
DataFrame.plot().
- Returns:
- matplotlib.axes.Axes or numpy.ndarray
Area plot, or array of area plots if subplots is True.
See also
DataFrame.plotMake plots of DataFrame using matplotlib.
Examples
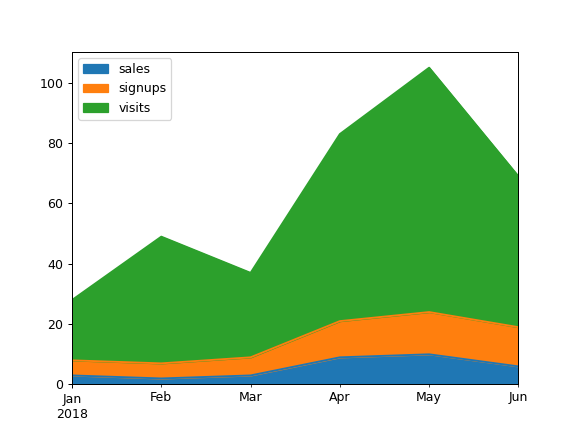
Draw an area plot based on basic business metrics:
>>> df = pd.DataFrame(
...     {
...         "sales": [3, 2, 3, 9, 10, 6],
...         "signups": [5, 5, 6, 12, 14, 13],
...         "visits": [20, 42, 28, 62, 81, 50],
...     },
...     index=pd.date_range(
...         start="2018/01/01", end="2018/07/01", freq="ME"
...     ),
... )
>>> ax = df.plot.area()
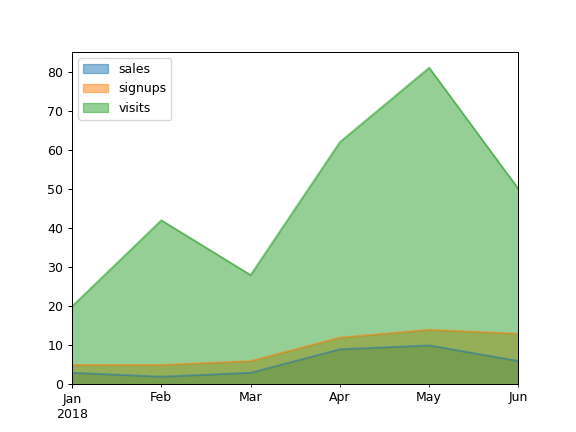
Area plots are stacked by default. To produce an unstacked plot, pass
stacked=False:>>> ax = df.plot.area(stacked=False)
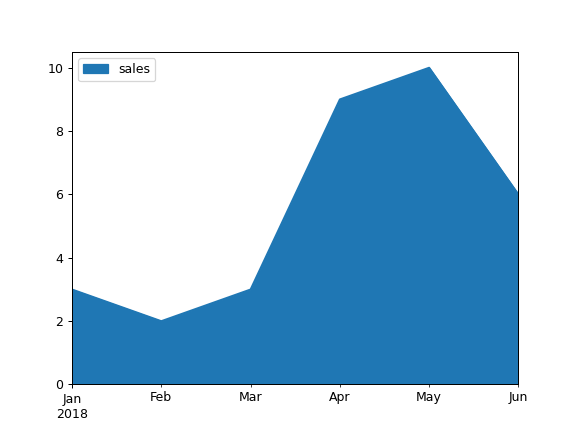
Draw an area plot for a single column:
>>> ax = df.plot.area(y="sales")
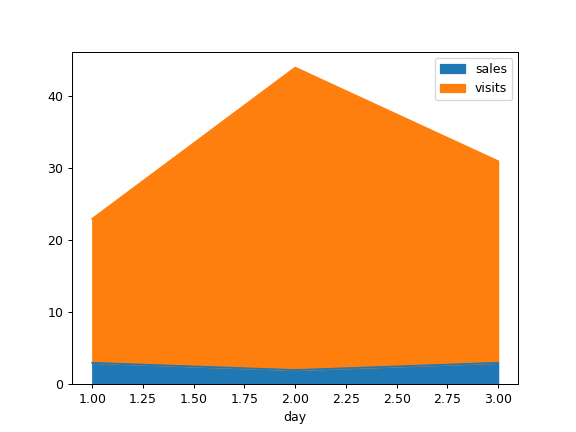
Draw with a different x:
>>> df = pd.DataFrame(
...     {
...         "sales": [3, 2, 3],
...         "visits": [20, 42, 28],
...         "day": [1, 2, 3],
...     }
... )
>>> ax = df.plot.area(x="day")