
pandas.Series.plot.area#
- Series.plot.area(x=None, y=None, stacked=True, **kwargs)[source]#
Make a stacked area plot.
An area plot displays quantitative data visually. This function wraps the matplotlib area function.
- Parameters:
- xlabel or position, optional
Coordinates for the X axis. By default uses the index.
- ylabel or position, optional
Column to plot. By default uses all columns.
- stackedbool, default True
Area plots are stacked by default. Set to False to create a unstacked plot.
- **kwargs
Additional keyword arguments, such as
ax,figsize,titleandlegend, are documented inDataFrame.plot().
- Returns:
- matplotlib.axes.Axes or numpy.ndarray of them
An ndarray of
matplotlib.axes.Axesis returned whensubplots=True.
See also
DataFrame.plotMake plots of a DataFrame.
Examples
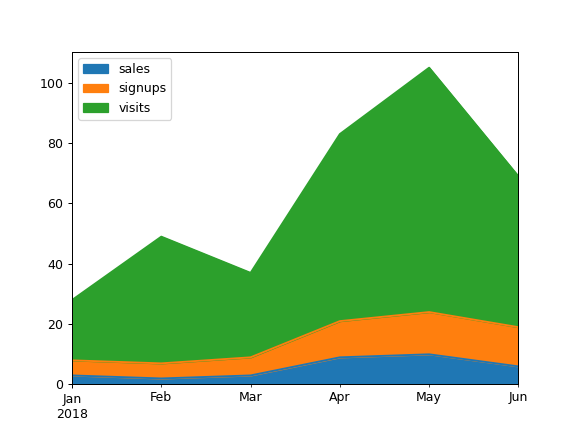
Draw an area plot based on basic business metrics:
>>> df = pd.DataFrame(
...     {
...         "sales": [3, 2, 3, 9, 10, 6],
...         "signups": [5, 5, 6, 12, 14, 13],
...         "visits": [20, 42, 28, 62, 81, 50],
...     },
...     index=pd.date_range(
...         start="2018/01/01", end="2018/07/01", freq="ME"
...     ),
... )
>>> ax = df.plot.area()
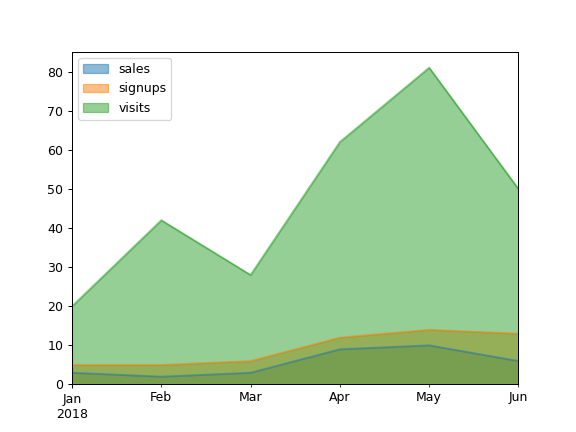
Area plots are stacked by default. To produce an unstacked plot, pass
stacked=False:>>> ax = df.plot.area(stacked=False)
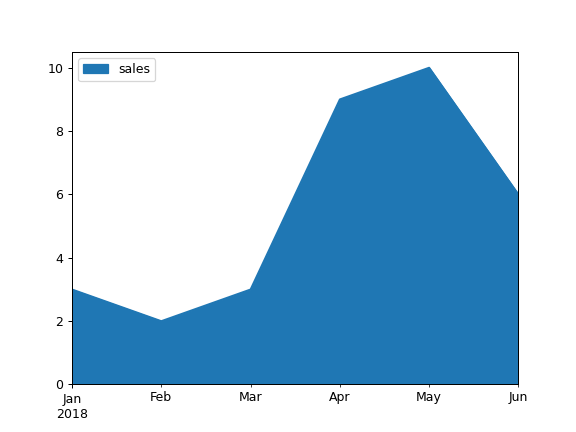
Draw an area plot for a single column:
>>> ax = df.plot.area(y="sales")
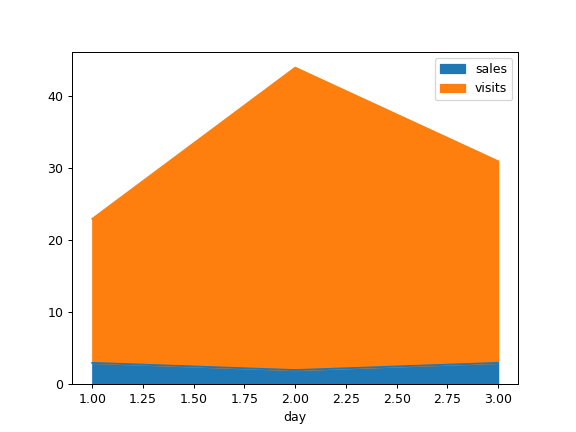
Draw with a different x:
>>> df = pd.DataFrame(
...     {
...         "sales": [3, 2, 3],
...         "visits": [20, 42, 28],
...         "day": [1, 2, 3],
...     }
... )
>>> ax = df.plot.area(x="day")